Infusion Center Staffing Models and Productivity Benchmarks
Why chair utilization misses the real nursing workload story.
Chair utilization is the wrong number, and most infusion centers still lead with it anyway. It tells administrators whether the room is full. It says nothing about how much nursing work went into filling it. The 2019 Infusion Center Volumes, Staffing, and Operations Survey put median scheduled chair utilization at 80% and actual utilization at 70%. That ten-point gap is where the real staffing story hides: a center running at "70% capacity" on paper can still be running its nurses into the ground underneath that number.
What acuity-based staffing measures that chair ratios miss
Acuity isn't one data point. It's a read on how complex a patient's care is, and how much nursing time that complexity actually eats up.
The old standard, 8 to 10 patients per nurse, comes from a different era of oncology care, back when traditional chemotherapy dominated the infusion suite. Biologics, immunotherapies, and cellular therapies don't behave like the drugs that ratio was built around, and they weren't around in anything like today's volume when the ratio got set. Holding onto it anyway is the mistake most centers are still making, and it's worth naming first, because everything downstream depends on fixing it.
Research from Sabo-Wagner and colleagues, presented at the 2025 ASCO Quality Care Symposium and published in JCO Oncology Practice, looked at 12 months of claims across 90 clinics, roughly 1,150 daily encounters. Average chair time came out to 2 hours. Average nursing time per patient landed at 1.4 hours, but that average hides a real split: patients on anti-cancer therapies needed 1.4 hours of nursing time, while therapeutic-only services needed 0.9 hours. Anti-cancer therapies made up 37% of the services in that dataset. Mix that many high-acuity patients into a day alongside lower-acuity ones, and the nursing load swings in ways a chair-fill percentage can't show. It was never built to show it.
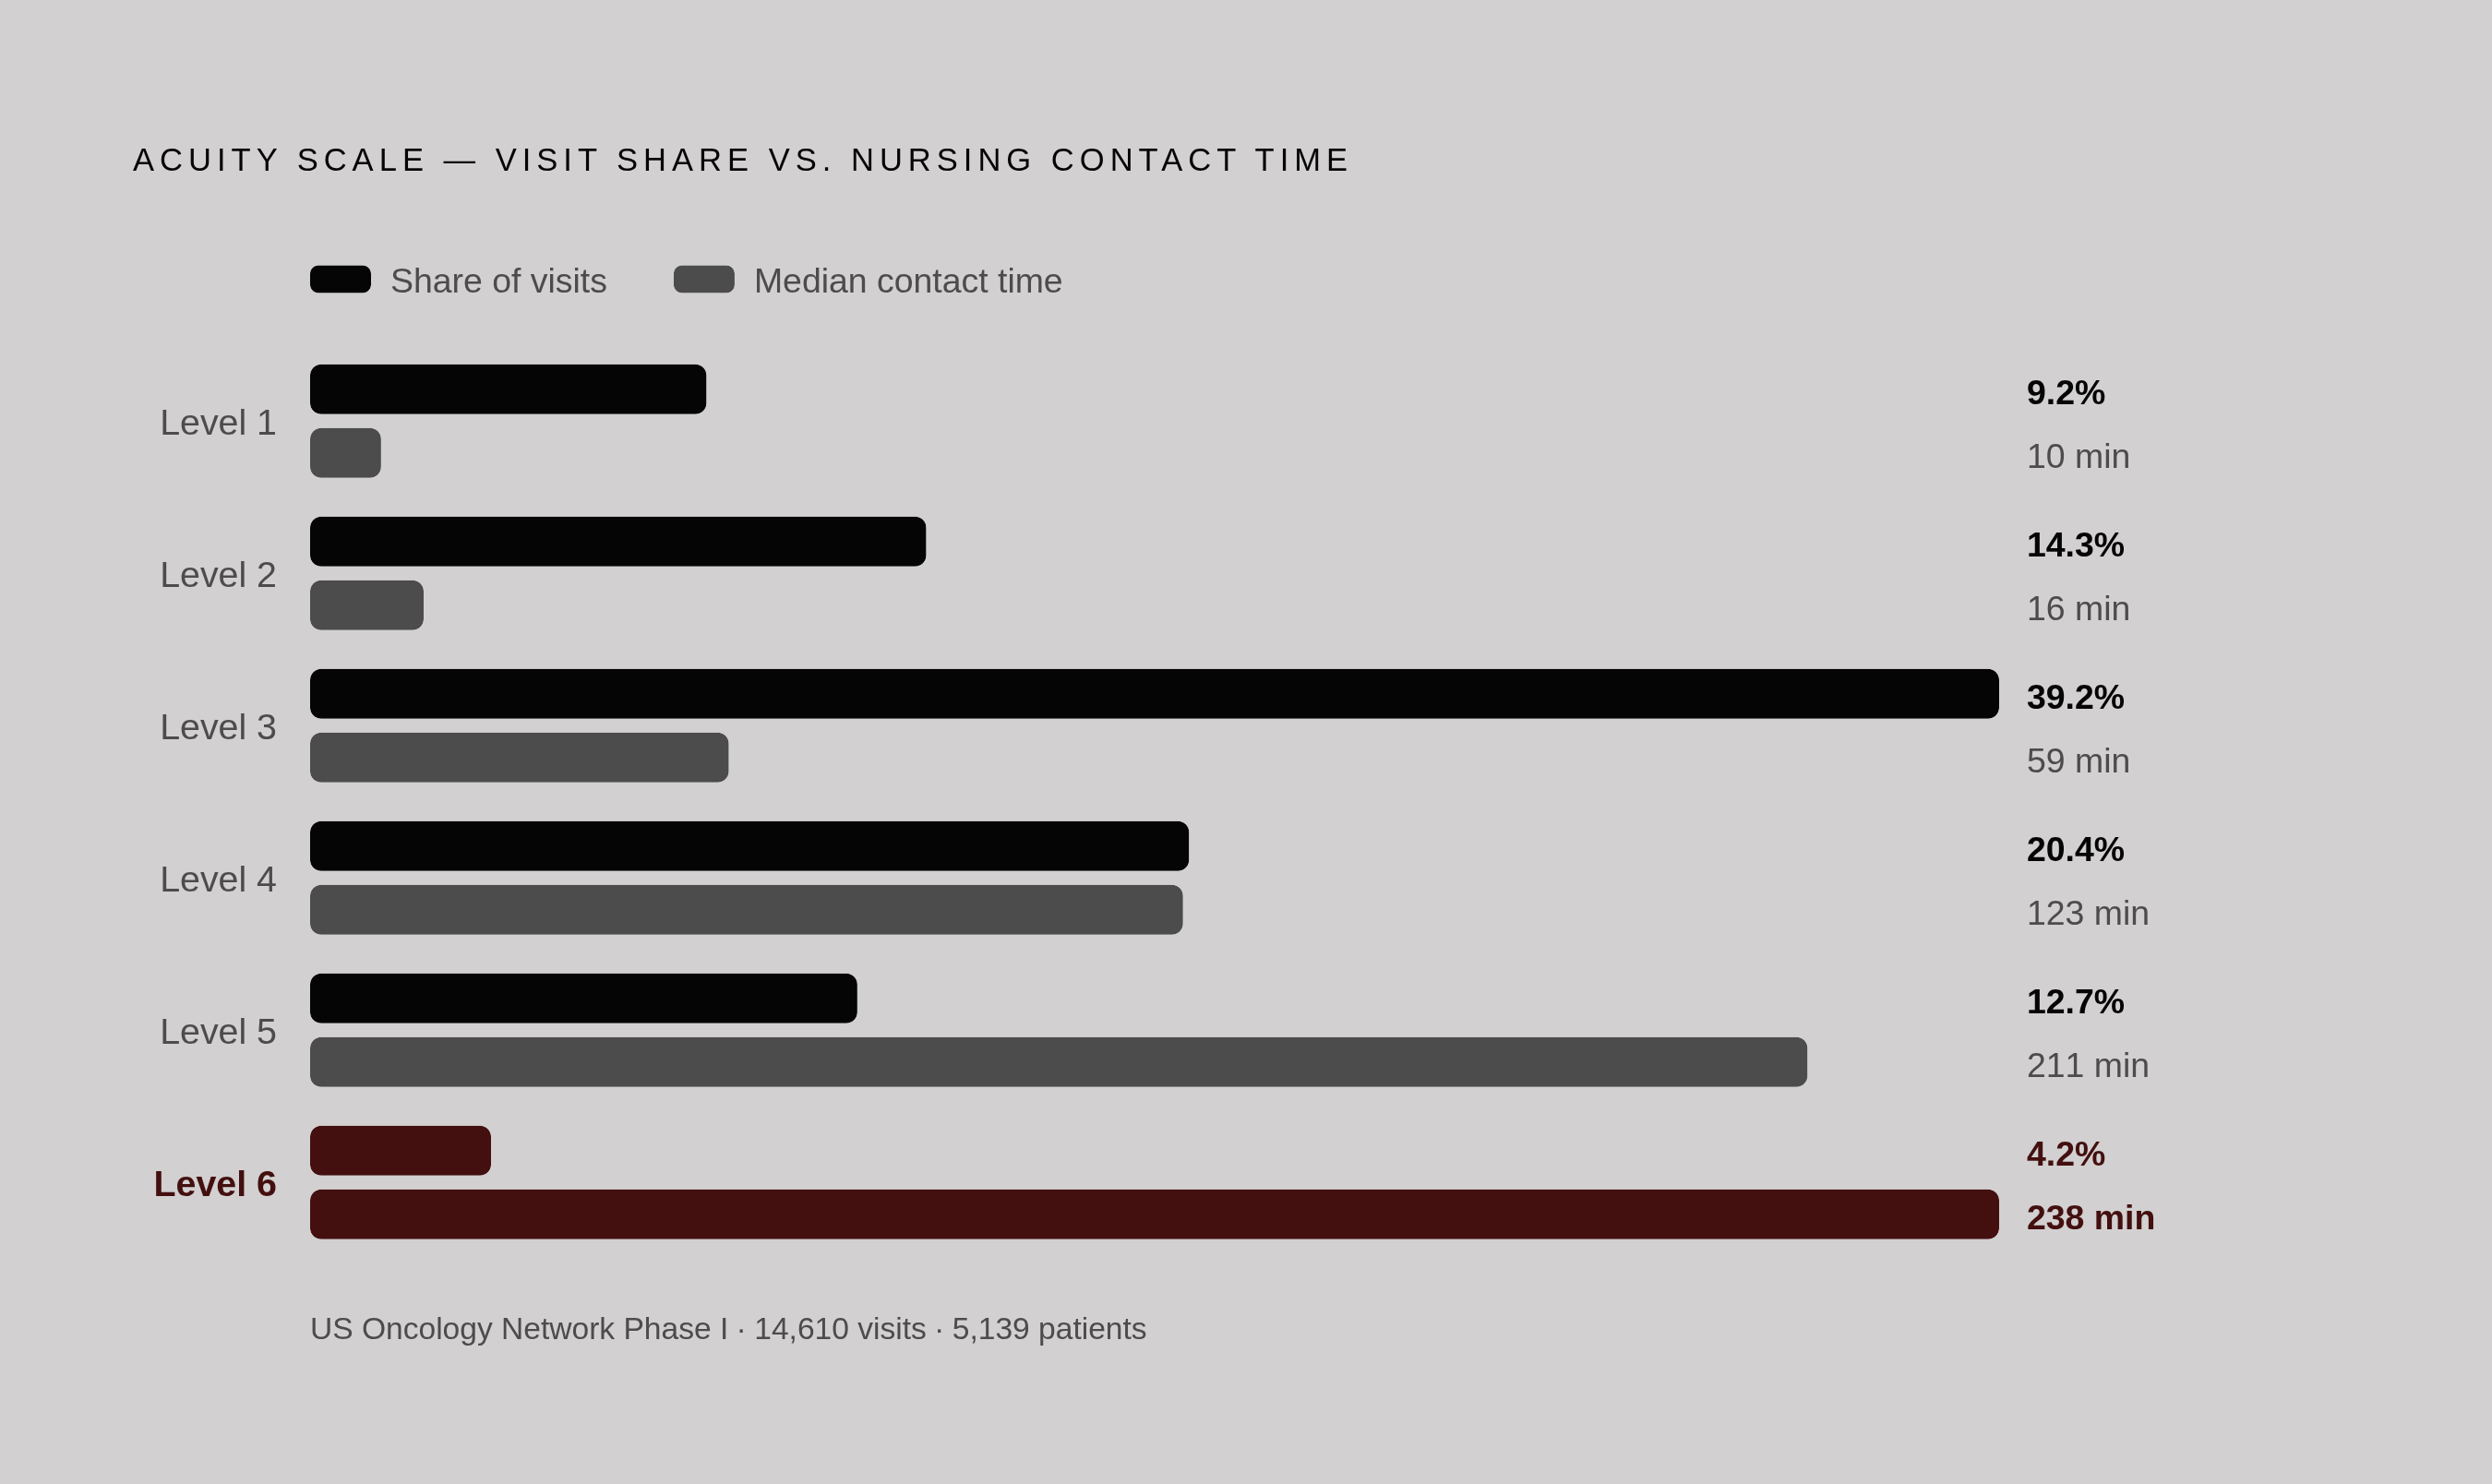
The US Oncology Network's Phase I acuity study (Egan, Gehrke, He, et al., presented at the 2024 ASCO Annual Meeting) tracked 14,610 infusion room visits across 5,139 patients on a six-level acuity scale. Documentation rates across participating sites ranged from 60% to 96% week over week. That range is the real finding here: consistent acuity measurement is possible, but it takes deliberate workflow design, not a form nurses are handed and told to fill out.
The score distribution is where the staffing story actually lives:
- Level 1 (lowest acuity): 9.2% of visits, median 10 minutes
- Level 2: 14.3% of visits, median 16 minutes
- Level 3 (the modal level): 39.2% of visits, median 59 minutes
- Level 4: 20.4% of visits, median 123 minutes
- Level 5: 12.7% of visits, median 211 minutes
- Level 6 (highest): 4.2% of visits, median 238 minutes
Levels 2 and 3 together account for just over half of visits on any given day. Drop one level-5 or level-6 patient into that mix, though, and that single patient can eat up as much nursing time as several lower-acuity visits combined. A ratio-based model has no way to see that coming.
None of this makes acuity tools easy to run. They add scoring work for nurses, scores vary across nurses and settings, and there's still limited clarity on what these scores predict downstream. That weak link is exactly why the US Oncology Network project is pushing toward a predictive model instead of leaning on real-time nurse judgment at check-in. Sabo-Wagner's data backs up the case for looking past averages: average services per treated patient came out to 2.2, but the range ran from 1 to 7. Nursing leaders surveyed in that work reported more cognitive load and burnout on days built around headcount-based staffing, especially when higher-acuity therapies and newer drug classes filled the schedule.
How staffing structures translate volume and acuity into working schedules
Measuring acuity is only half the job. Somebody still has to turn that number into a schedule with real people on it, and infusion centers generally lean on three structures to do it.
Salaried staff give predictable coverage and let a center build culture and communication over time, with the employer absorbing the risk when volume swings. Infusion magazine (Jan/Feb 2024) points to 0.8 FTE, four 8-hour shifts, as the sweet spot for salaried infusion nurses: enough flexibility to avoid gap days without over-committing hours. Hourly staff bring clearer time accountability and transparent overtime triggers. Per diem and per-visit staff cover surge days and high-census stretches, though that only works with tiered pay that accounts for drive time, documentation, and the real difference between a short lab or line-care visit and a long drug-administration one.
Blend a core salaried team with a per diem bench, and scheduling flexibility improves without inflating base labor costs. The salaried core builds consistency and institutional memory. Per diem staff absorb the peaks. Lean too hard on either one alone and something breaks: all salaried, and surge days bury the floor; all per diem, and nobody remembers how last Tuesday went.
Advisory Board's 2024 benchmarking work, conducted from March through June and covering 90 cancer programs across more than 40 health systems (36 infusion administrators specifically), is the best peer-comparison data available right now for this kind of design work.
The more forward-looking centers are moving toward "pull" scheduling: staffing to forecast demand instead of reacting to whoever shows up. LeanTaaS points to this approach as the strongest model available, and its case study numbers back that up. Nebraska Medicine and Rush University Cancer Center served up to 10% more patients using this kind of analytics-driven approach. NewYork-Presbyterian and Columbia University Irving Medical Center cut wait times by 8% while taking on 25% more same-day add-ons. NewYork-Presbyterian Brooklyn Methodist Hospital used its scheduling data to grow into new space and serve 28% more patients.
None of those gains came from hiring more nurses. They came from lining up staff presence with predicted demand, and that only works if the forecasting underneath it actually holds up.
What predictive analytics and AI actually contribute to infusion workforce planning
LeanTaaS and similar platforms make the case plainly: staffing infusion centers well takes predictive math, not a manager's gut feeling. That case only gets stronger as volume climbs, and reactive staffing gets harder to defend every year chronic disease volume keeps rising.
Phase II and III of the US Oncology Network's acuity project aim to build prospective staffing models straight out of patient clinical data, cycle day, number of drugs on board, emetic risk, rather than a nurse's judgment call at check-in. Acuity alone may not capture the full picture of what drives staffing needs on a given day. Patient flow timing, pharmacy prep cycles, and how fast chairs turn over all interact with acuity to decide whether a given staffing level actually holds up on a given day.
A LeanTaaS webinar on the topic, featuring leaders from Northern Arizona Healthcare, Tucson Medical Center, and Nuvance, made a point worth repeating: staffing plans work best when nurses and managers help build them, not just receive them. Predictive analytics sets the starting parameters. Clinical staff still validate them and adjust for what the model can't see.
Data quality is the catch, and it's not a small one. The US Oncology Network's Phase I documentation rates ranged from 60% to 96% across sites, and the sites clustered near that low end simply don't have the input data to support reliable forecasting. Buying a predictive tool doesn't fix that gap on its own, and technology without documentation discipline behind it doesn't produce better staffing decisions. The workflow and the analytics have to get built together, not bolted on in sequence.
How staffing structure upstream of billing sets the financial ceiling for an infusion practice
Most revenue cycle problems in infusion don't start at the billing desk. They start earlier, in scheduling and clinical workflow: an eligibility gap that never got caught, a prior authorization that expired mid-cycle, documentation that doesn't quite support the claim.
The dollar amounts involved make this more than a paperwork issue. Infusion visits often generate charges from the thousands into the tens of thousands per encounter, and a single denied biologic can tie up drug cost alone in that same range. That's a cash-flow event, not a line item to clean up later.
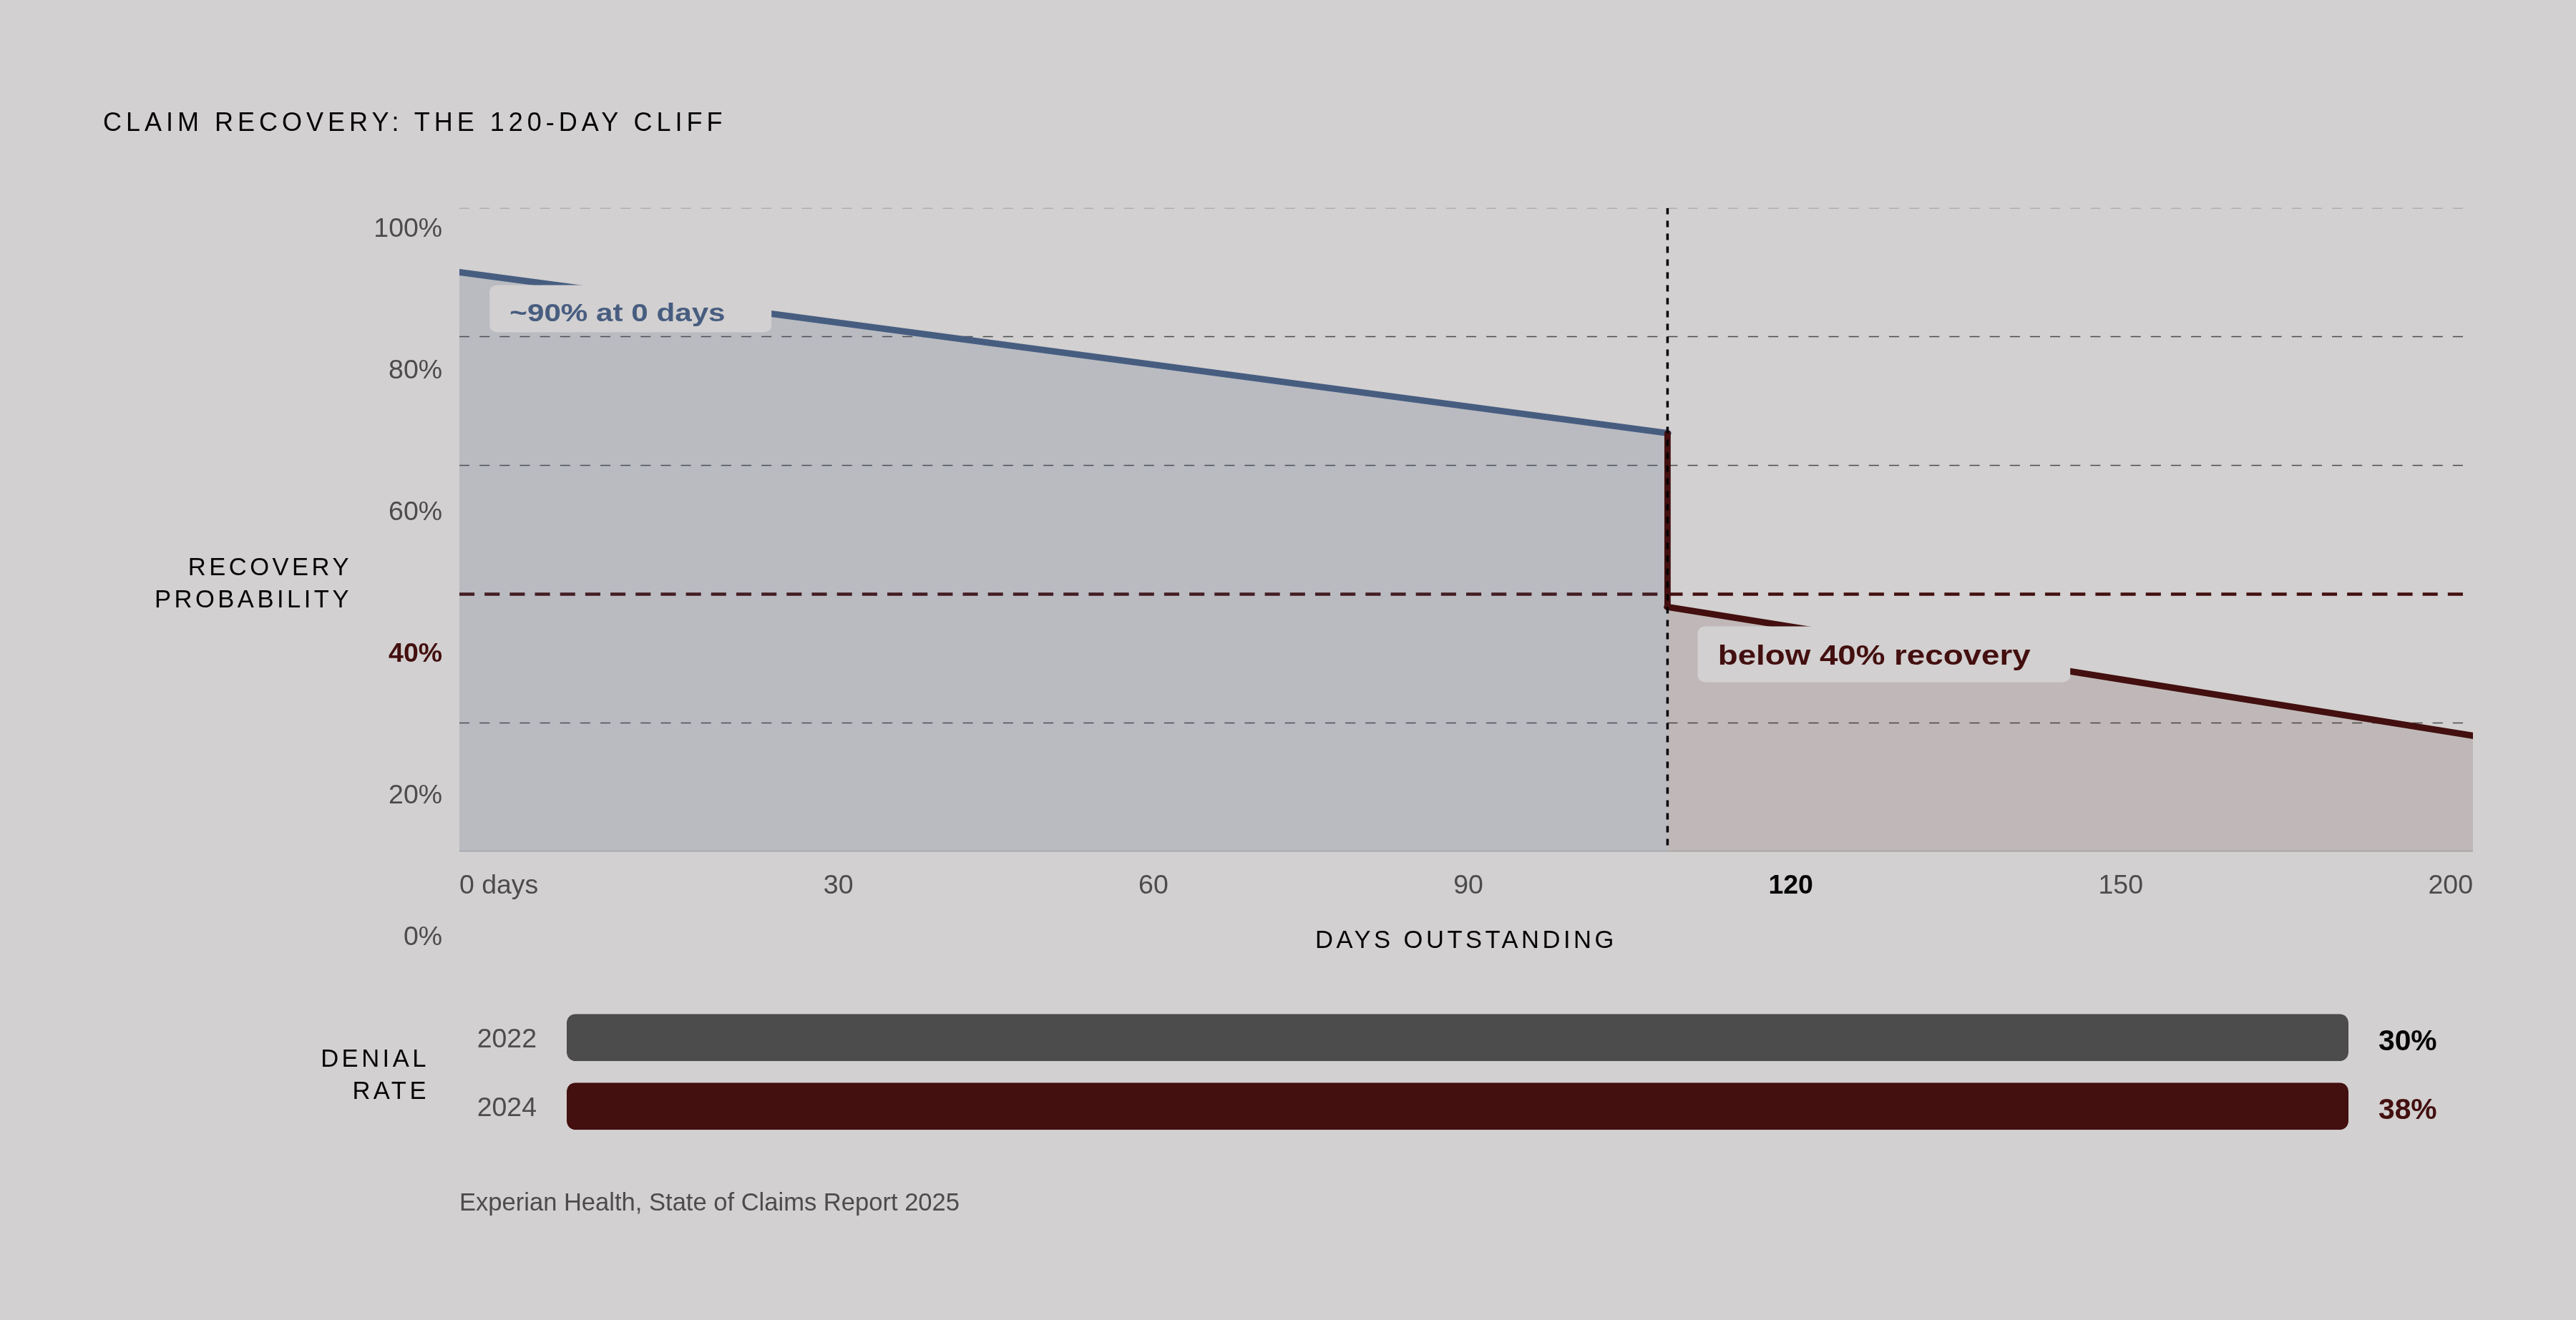
The denial numbers back this up. Per Experian Health's 2025 State of Claims Report, claim denials climbed from 30% in 2022 to 38% in 2024. Once a claim passes 120 days outstanding, the odds of ever collecting on it drop below 40%.
Staffing structure connects to those numbers directly. Understaffed or ratio-based teams have less slack to catch a prior authorization mismatch, a drug-to-diagnosis inconsistency, or an eligibility lapse before the patient is already in the chair. Worse, the highest-acuity days, the ones that already max out nursing capacity, are the same days that compress the time available for pre-visit verification. Clinical risk and financial risk pile up on the exact same calendar dates. And when scheduling runs reactive instead of predictive, same-day add-ons and last-minute changes create the exact conditions where nobody confirms authorization status before the drug is hung.
SamaCare's 2022 survey found that 91% of providers said repeated prior authorization delays or denials would change their willingness to prescribe a drug, given an equally effective alternative. Denial patterns don't just cost money on the claim in front of them. They shape which drugs get prescribed going forward, and that reshapes future volume, especially for the high-complexity specialty infusions and biologics that already carry the highest acuity scores and the longest chair times.
A center that invests in acuity-based staffing and predictive scheduling isn't just running a tighter clinical floor. It's building the operational room for staff to actually finish pre-visit financial checks before the patient sits down.
Where payer behavior is making the staffing-revenue link harder to ignore
Payers are tightening site-of-care rules. Both UnitedHealthcare and Aetna now restrict reimbursement for hospital outpatient infusions when a lower-cost ambulatory setting is available and clinically appropriate.
The cost gap driving this is real: home infusion runs 40% to 60% cheaper than hospital outpatient administration, a cost difference that commercial payers are acting on through narrow networks, site-of-care prior auth rules, and tiered cost-sharing.
CMS is adding to the pressure for 2026. The Physician Fee Schedule includes a 2.5% efficiency adjustment applied to nearly all non-time-based services, and the CY2026 OPPS and ASC Final Rule extends site-neutral payment policy to drug administration services at off-campus hospital outpatient departments and ASCs. The same drug, given the same way, can now reimburse differently depending on where it's billed from and under which entity.
Coverage rules keep shifting under all of this. Documentation expectations get more detailed each cycle, high-cost therapies draw more scrutiny, and authorization requirements for the identical drug can differ by payer, plan type, and site of care.
That kind of administrative tangle has no business sitting on clinical nurses working under an old ratio model. It takes dedicated, specialized revenue cycle staff running in parallel with the clinical team, tracking payer-specific rules, renewal timing, and site-of-care appeals as their actual job, not something squeezed in between patients. Centers relying on generalist billing staff or general-purpose billing software are exposed here in predictable ways: J-code errors, CPT sequencing mistakes on primary, concurrent, sequential, and push services, and NCCI edit failures are what happens when the tool wasn't built for infusion billing logic in the first place. In most mid-market infusion organizations, a handful of root causes drive most of the denial rate: prior authorization mismatches, drug-to-diagnosis inconsistencies, eligibility lapses, and timely-filing misses on secondary claims. They cluster by payer, by therapy, and by site, which means they're findable and fixable if someone's actually looking.
What an operationally sound infusion staffing model looks like when RCM is built into the design
Staffing decisions and revenue cycle ownership need to get designed together, not handled one after the other. By the time a claim goes out the door, most of the problems that will sink it have already happened upstream, and no amount of billing-desk cleanup fixes something that broke three steps earlier.
On the clinical side, staffing built around acuity or actual service time, the approach the research on acuity-based models points toward, gives nurses the breathing room to handle pre-visit financial checks. When nurses aren't buried by an understaffed floor, the handoff to RCM staff actually happens instead of getting skipped under pressure.
On the authorization side, a dedicated team trained on payer-specific clinical criteria and renewal timing cuts both the denial rate and the load on clinical staff. Prior auth work has to start before the treatment cycle begins, not after a lapse turns into a denial.
Tying authorization status directly into the scheduling system stops treatment from starting before approval comes through, which is usually the fastest route to a claim that never gets paid. That's a workflow design question first, a software question second.
A few metrics tell an operator whether the system is actually working:
- First-time denial rate broken out by payer and therapy type, not lumped into one aggregate number
- Prior authorization approval rate and average payer turnaround time by drug
- Chair utilization tracked alongside nursing time per patient, since the gap between the two shows exactly where capacity and workload have drifted apart
- AR aging on high-dollar claims, watched as an early warning sign rather than a quarterly retrospective, given that recovery odds fall below 40% once a claim passes 120 days
The staffing model that supports all of this runs infusion-specialized revenue cycle work in parallel with clinical staffing, not stacked downstream of it. Operators should be able to see status and outcomes without personally chasing payer portals or reconciling remits by hand. Infusion-specific RCM platforms built around the realities of buy-and-bill and biologics billing, pairing software with people who actually run the authorization and reimbursement process, give practices that structure without turning clinical leaders into billing specialists on the side.
The benchmark worth holding onto: volume growth like Nebraska Medicine and Rush's 10% increase, or NewYork-Presbyterian Brooklyn Methodist's 28% jump after a data-driven expansion, only turns into revenue if the claims behind that added volume actually get paid. Staff more patients through a leaky revenue cycle, and the leak just gets bigger.
Sources
- Infusion center benchmarks: Key insights from Advisory Board surveys
- Future-Proofing the Infusion Workforce for 2025
- Objective acuity measures for infusion therapy staffing: A predictive model approach—Phase I. | Journal of Clinical Oncology
- Optimizing Infusion Nursing Productivity Infusion • January/February 2024
- Rethinking infusion staffing metrics to address the complexity of modern hematology-oncology therapies. | JCO Oncology Practice
- Development of Productivity Standards for Ambulatory Infusion Suite Nurses Within a Multi-Entity Health System - National Home Infusion Association
- Rethinking Oncology Infusion Staffing Models and Workload
- Using Acuity to Predict Oncology Infusion Center Daily Nurse Staffing and Outcomes | Oncology Nursing Society