Business Plan Financial Model for a New Infusion Center
How to build a financial model that accounts for drug costs, prior auth delays, and denial risk.

Infusion therapy is expanding fast, and the financial model for a new center has to account for that growth, beyond the demand sitting in front of it today. The market is projected to grow at 8.8% a year between 2025 and 2035, which puts infusion in a different category than a mature, steady-state specialty. Deal activity backs this up: 2024 saw 11 announced platform deals in infusion, meaning financial buyers are already underwriting these businesses at scale and have opinions about what makes one work.
The referral gap is real too. Roughly 75% of community hospitals don't have a home infusion program, compared to about half of integrated delivery networks. That's a wide-open lane for independent, freestanding centers to catch patients who'd otherwise have nowhere local to go. And the drug pipeline supports the long game: more than 60% of therapies currently in development are infusion-delivered. This isn't a market riding on a handful of legacy biologics. Volume assumptions five and ten years out have real pipeline support behind them.
Structural differences between infusion financial modeling and a standard medical practice pro forma
Most medical practice pro formas run on a simple formula: project patient volume, multiply by an average reimbursement rate, subtract overhead, and call it net income. That formula breaks down fast in infusion, because it treats every dollar of charge as equally likely to convert into cash on a predictable timeline. Infusion doesn't work that way.
A handful of variables generic models leave out entirely, and each one changes the shape of the P&L:
Drug cost isn't just a cost-of-goods line, it's a balance sheet event. A single biologic dose can run tens of thousands of dollars, and the center pays for it before knowing whether the payer will approve the claim. Prior authorization acts as a gate, not a formality: no auth means no treatment, no matter how full the chair schedule looks. Reimbursement timing varies by drug, by payer, and by J-code, so there's no single lag assumption that fits the whole business. Denial risk clusters on the highest-dollar claims, so the claims a center can least afford to lose are also the ones most likely to get kicked back. And buy-and-bill means the center is carrying the spread between what it paid for the drug and what it eventually collects, as real financial exposure, for the entire time a claim sits in limbo.
Site-of-care policy adds one more wrinkle. UnitedHealthcare, for instance, ties reimbursement to whether a patient meets criteria for outpatient hospital versus an alternative site of care. That's a payer-by-payer rule, not something you can average across the whole payer mix. Put together, these aren't footnotes to bolt onto a standard model after the fact; they're the primary inputs the model has to be built around from the start. They're the primary inputs the model has to be built around from the start.
Modeling drug cost exposure and buy-and-bill financial risk
Buy-and-bill, in plain terms: the center buys the drug first, administers it, submits the claim, and then waits to get paid. The gap between that purchase and that payment is working capital exposure, sitting on the center's books the whole time.
J-code billing makes this harder than it sounds. Medication-related denials account for nearly 20% of outpatient claim rejections nationwide, and CMS has tightened enforcement in 2026 around product-specific J-codes, quarterly ASP reporting, and documentation requirements, aimed mostly at manufacturers but with ripple effects for anyone billing off those codes.
A model built for this reality needs a few specific inputs, not blended averages:
Model actual drug cost per therapy. ASP-based reimbursement rate, tracked drug by drug, since ASP updates quarterly and has to be treated as a moving variable. Days between drug acquisition and expected payment, modeled payer by payer rather than with one lag number for everything. And waste exposure: unused partial vials and dose rounding are common with high-cost biologics and rarely get reimbursed, so that loss needs its own line.
Biosimilar competition adds volatility on top of all this. As of March 2026, the FDA had approved 82 biosimilars, and health plans and PBMs are actively rewriting formularies and step-therapy rules as more of them hit the market. Reimbursement on reference biologics shouldn't be treated as a fixed number in any model built past this point. Treat it as a variable that can move mid-year.
Building prior authorization timelines into the revenue model
If a model assumes treatment starts the moment a patient is scheduled, the revenue projection is wrong before it's even printed. Prior auth creates a real delay between referral and the first billable infusion, and that delay has to appear in the model as its own line, not get absorbed into a vague ramp-up assumption.
There's a silver lining buried in the denial data: nearly 82% of denials are eventually overturned due to administrative errors. That means most of this loss is preventable, but only if the center actually staffs and builds the workflow to catch it. Left unstaffed, those preventable denials become permanent ones.
Reauthorization adds another layer of complexity for ongoing infusion therapies. Payers increasingly treat reauth as a separate, recurring process rather than a one-time approval. It needs continuous tracking, not a single checkbox at intake. A model has to capture average approval timelines by payer and by therapy, since that drives the lag between scheduling and first revenue. It also needs reauthorization frequency built in, because a model that assumes ongoing treatments just continue uninterrupted will overstate steady-state revenue.
Authorization gaps are the sharpest risk here. A visit rendered without a valid auth on file generates a denial on a high-value claim, and that kind of denial typically isn't recoverable after the fact. That's not a timing issue to smooth over in cash flow, it's a hard loss straight to the bottom line.
State rules complicate the picture further. Connecticut bans step therapy outright for MS and RA drugs, while capping it at 30 days for other drug classes. New Jersey requires its Medicaid program to grant step therapy exceptions under specific clinical conditions. These state-by-state differences change how fast a patient reaches the intended therapy, and therefore when revenue actually starts.
Modeling denial rates and their effect on net revenue projections
In 2025, hospitals missed $48.4 billion in collectible revenue, roughly 25% more leakage year over year, across a dataset covering thousands of hospitals and hundreds of thousands of physicians. That leakage doesn't spread evenly. It concentrates in exactly the claim profile infusion centers generate most: high-dollar, clinically complex, prior-auth-dependent.
A few numbers should anchor the model's denial assumptions directly. Median final denial rates climbed from 2.5% in 2024 to 2.7% in 2025, and a new center without an established payer track record should treat that as a floor. Average clinical initial denial rates rose from 2.4% to 2.6% over the same stretch, while the provider overturn rate actually dropped, from 42.7% to 42.1%. That combination means a growing share of clinical denials are turning into permanent losses rather than temporary delays. Inpatient clinical denial rates jumped more than 12% in 2025 alone, a clear signal that payer scrutiny is getting tighter, not settling down.
50% to 65% of denied claims never get reworked. Without dedicated staff chasing them down, that's the default outcome, not an edge case. Gross charges minus a contractual adjustment is not net revenue. The model needs an explicit denial reserve line, built off realistic first-pass denial rates and a recovery rate that matches whatever staffing and workflow the center actually plans to fund.
Accounts receivable aging and cash flow projections for high-dollar infusion claims
Kodiak Solutions' 2025 data shows average time to insurance payment dropping from 57.4 days in 2024 to 55.2 days in 2025. That's a reasonable industry baseline, but it's an average across all claim types, not infusion specifically, and a new center shouldn't expect to start anywhere near that number.
A few things push infusion AR wider than that baseline. Drug cost is already spent by the time a claim works through auth, submission, and adjudication, so the cash is out the door long before it comes back. Clinical denial appeals require physician time and stretch out over weeks. And processing speed varies enormously payer by payer, so a model that applies one flat lag assumption across the whole payer mix will produce a monthly cash flow forecast that's wrong in both directions at once.
Patient balances make the picture worse, not better. Insured patient yield sat at 45.1% in 2024 and has been trending downward, meaning even after a payer pays its share, collecting the patient's portion is getting harder. Infusion patients often carry high-deductible plans, and on therapies costing tens of thousands of dollars, that patient responsibility adds up fast.
A model built for this reality needs a few structural features. AR aging buckets should run by payer as well as by days outstanding. Cash flow needs two separate schedules, one for drug acquisition spend and one for expected reimbursement receipt, so the working capital gap is visible on its own. Run at least one scenario where a high-dollar biologic is in a 90-day denial fight and see what that does to the monthly cash position. And set an explicit operating reserve, not just a breakeven-month projection, because breakeven on paper means nothing if the center runs out of cash three months before it gets there.
Staffing and overhead cost assumptions that generic models get wrong for infusion
Generic pro formas tend to understaff infusion in ways that stay hidden until the center is already open and drowning in unpaid claims. Prior authorization needs a dedicated staff role, with full time devoted to it rather than a fraction of a medical assistant's time squeezed between other tasks. Denial management needs its own function too: with 50% to 65% of denials going unworked industry-wide, and infusion rework often requiring clinical documentation and peer-to-peer physician calls, this isn't a job that gets done as a side task.
Billing staff need to actually know J-code mechanics and buy-and-bill workflows. General medical billing experience doesn't transfer cleanly here, and the learning curve costs real money in denied claims. Nursing staffing has its own logic too: infusion is chair-based and session-length dependent, so volume projections should come from chair capacity and average infusion duration specific to infusion.
Technology spend belongs in the model as a real cost. The share of healthcare organizations in one country running multiple automation tools jumped from 30% in 2025 to 50% in 2026, which says automation is turning into a baseline cost of running a competitive revenue cycle function... healthcare organizations running multiple automation tools jumped from 30% in 2025 to 50% in 2026, which says automation is turning into a baseline cost of running a competitive revenue cycle function, not an optional add-on.
There's also a build-versus-buy decision to model explicitly. A new center often doesn't have the volume yet to justify full in-house RCM staffing at launch. Running a scenario using an infusion-specialized RCM partner, and comparing that cost structure and risk-adjusted revenue yield against building everything in-house from day one, gives investors a much clearer picture than assuming one path by default. Platform choice matters here too: general-purpose RCM tools aren't built for the authorization, J-code billing, denial management, and buy-and-bill workflows infusion actually runs on. Ruby RCM, a revenue cycle management platform built specifically for infusion centers that pairs software with hands-on operators to handle benefits verification, prior auth, claims, and denials, is one example of an infusion-specialized option worth modeling in that comparison. Whatever platform a center picks, its cost needs to be in the model, and so does its measurable effect on denial rates, auth gaps, and net revenue yield. That effect is a modeling input.
Structuring the revenue projection, from gross charges to expected net collections
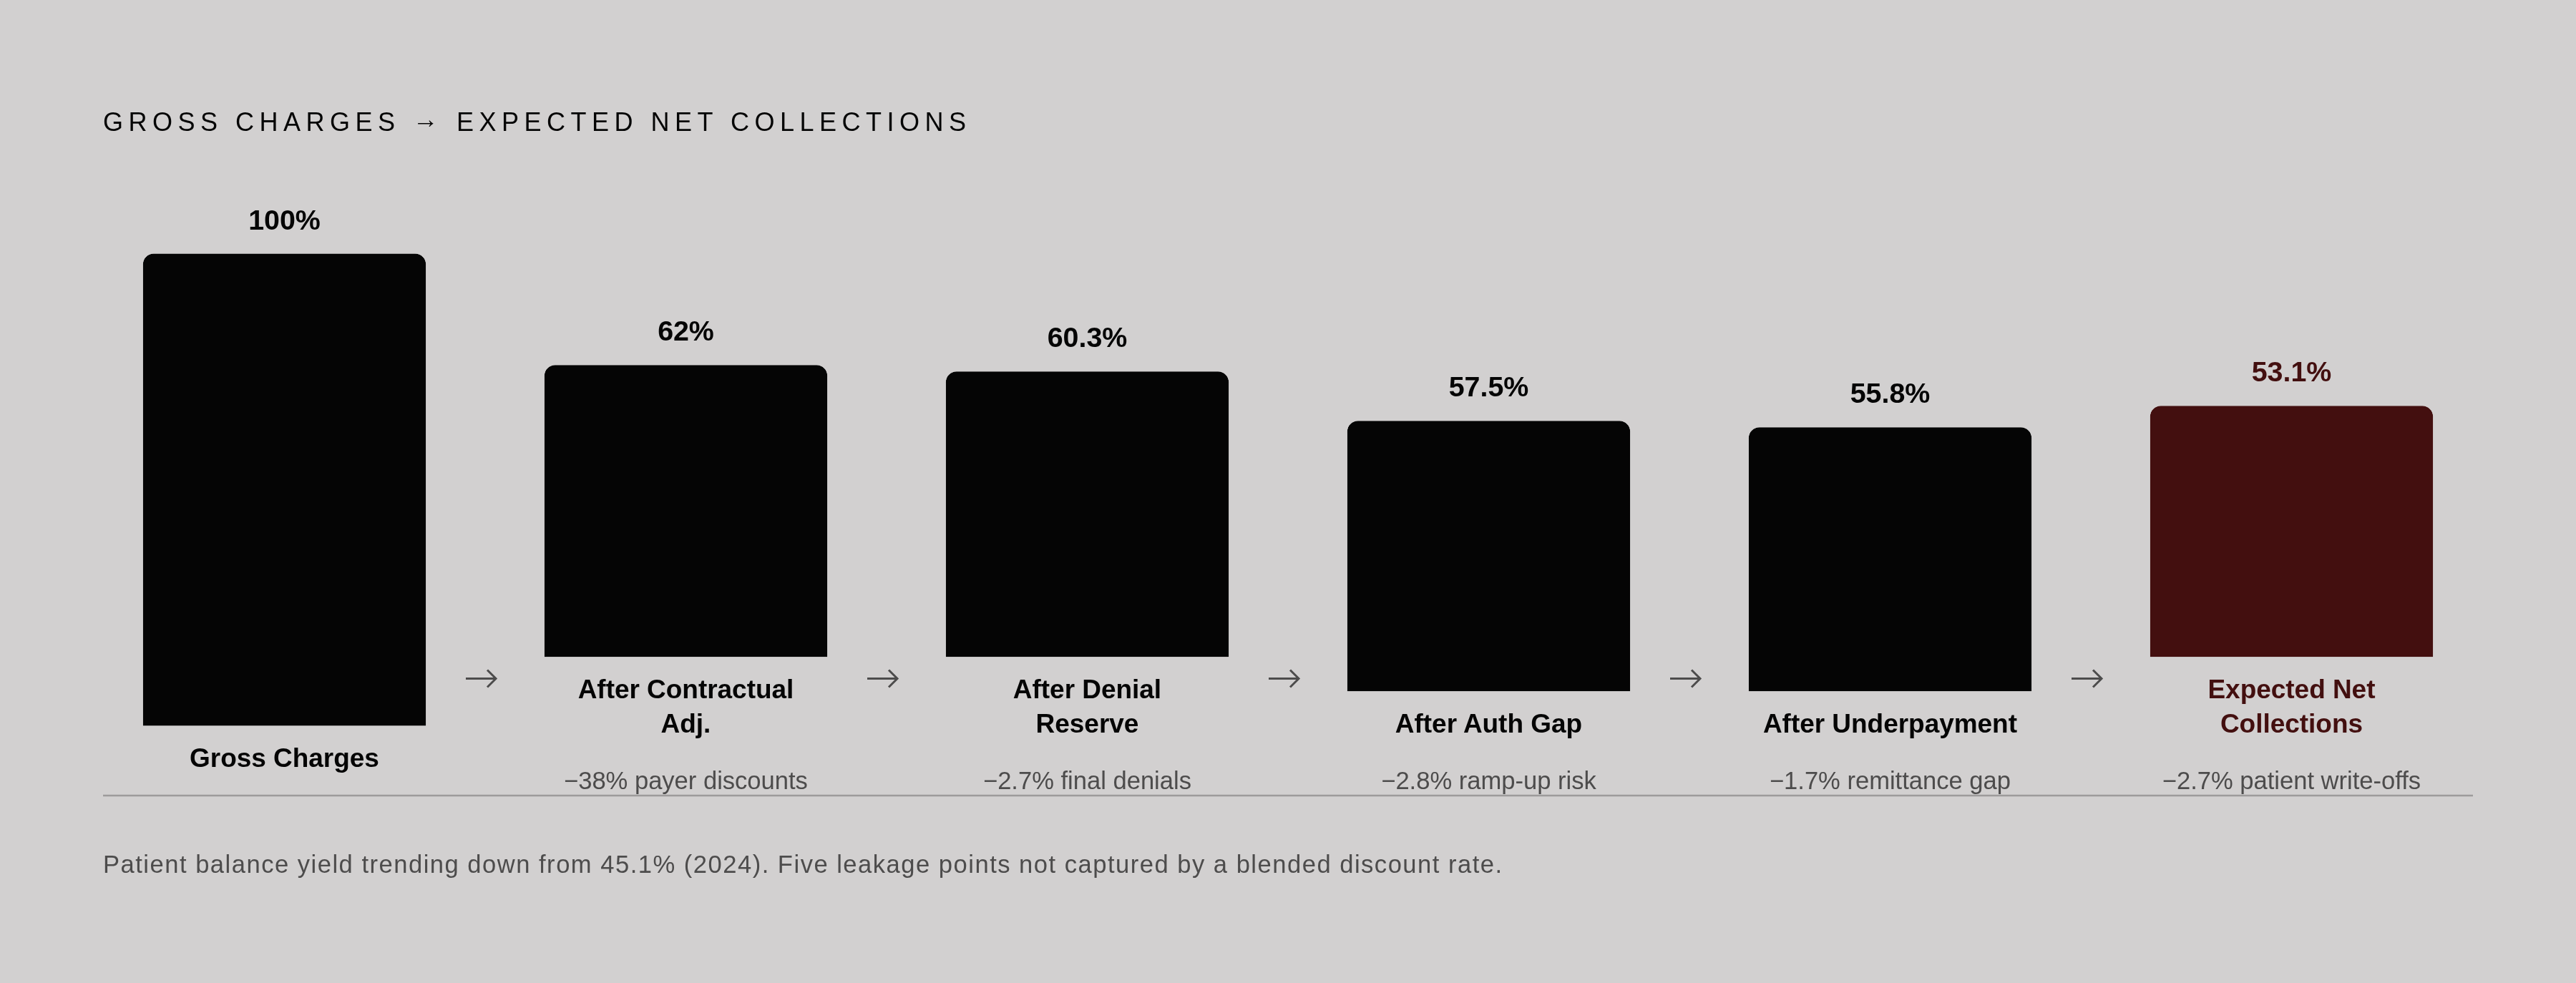
Revenue for an infusion center should run as a waterfall, with each layer modeled on its own rather than folded into a single blended discount rate.
Start with gross charges built from chair capacity times sessions. Because contracted rates vary too much to average, subtract contractual adjustments payer by payer. Subtract a denial reserve, using the benchmark denial rates above as a floor rather than a ceiling, paired with a realistic recovery rate given whatever staffing is actually funded. Subtract expected auth gap losses, estimating the share of sessions at risk of a gap denial during the ramp-up period specifically. Subtract underpayment leakage too: without line-level remittance reconciliation, underpayments quietly become permanent write-offs, so that reconciliation work needs to sit somewhere in the staffing plan or the outsourced RCM scope. Finally, subtract patient balance write-offs using a realistic yield assumption, not full collection, given that insured patient yield is trending down.
What's left after all five subtractions is expected net collections, and that's the number that actually matters, not gross charges.
Scenario planning isn't optional at this point. A model needs at minimum a base case, a payer-adverse case with higher denial rates and longer auth timelines, and a biosimilar disruption case where ASP shifts mid-year. The first 6 to 12 months deserve their own separate model entirely, since ramp-up carries lower volume, longer auth timelines, and no denial management track record yet, none of which match steady-state assumptions.
Once the model is built, test the output against industry benchmarks. If the projected net collection rate or AR days look meaningfully better than peer benchmarks, that's not a sign of a strong business. It's a sign something in the model is wrong.
Capabilities and limits of the completed model for investors and operators
A well-built infusion financial model tells investors and lenders one thing above all else: the founders know exactly where the revenue risk lives, not just where the upside sits. That distinction is visible in the details, in a denial reserve built off real benchmarks instead of a rounding error, in an AR schedule that treats payers differently instead of averaging them together, in a staffing plan that funds prior auth and denial management as actual jobs.
What the model can't do is guarantee any of those numbers land exactly as projected. Denial rates move, ASP updates shift reimbursement mid-year, and payer policies on site-of-care change without much warning. A good model doesn't promise precision, it promises that the risk is priced in honestly, with scenarios that show what happens when assumptions break instead of pretending they won't.
Sources
- Providers missing out on more revenue due to payers' denials
- Predict, prevent, perform: The AI evolution of denials management
- Denial Management in Revenue Cycle Management: The Complete Guide (2026)
- Why Infusion Providers Thrive with Payer Rules | ACU-Serve
- 247medicalbillingservices.com
- Health system infusion strategy | Cencora