Infusion Prior Authorization Denial Overturn Rates by Payer
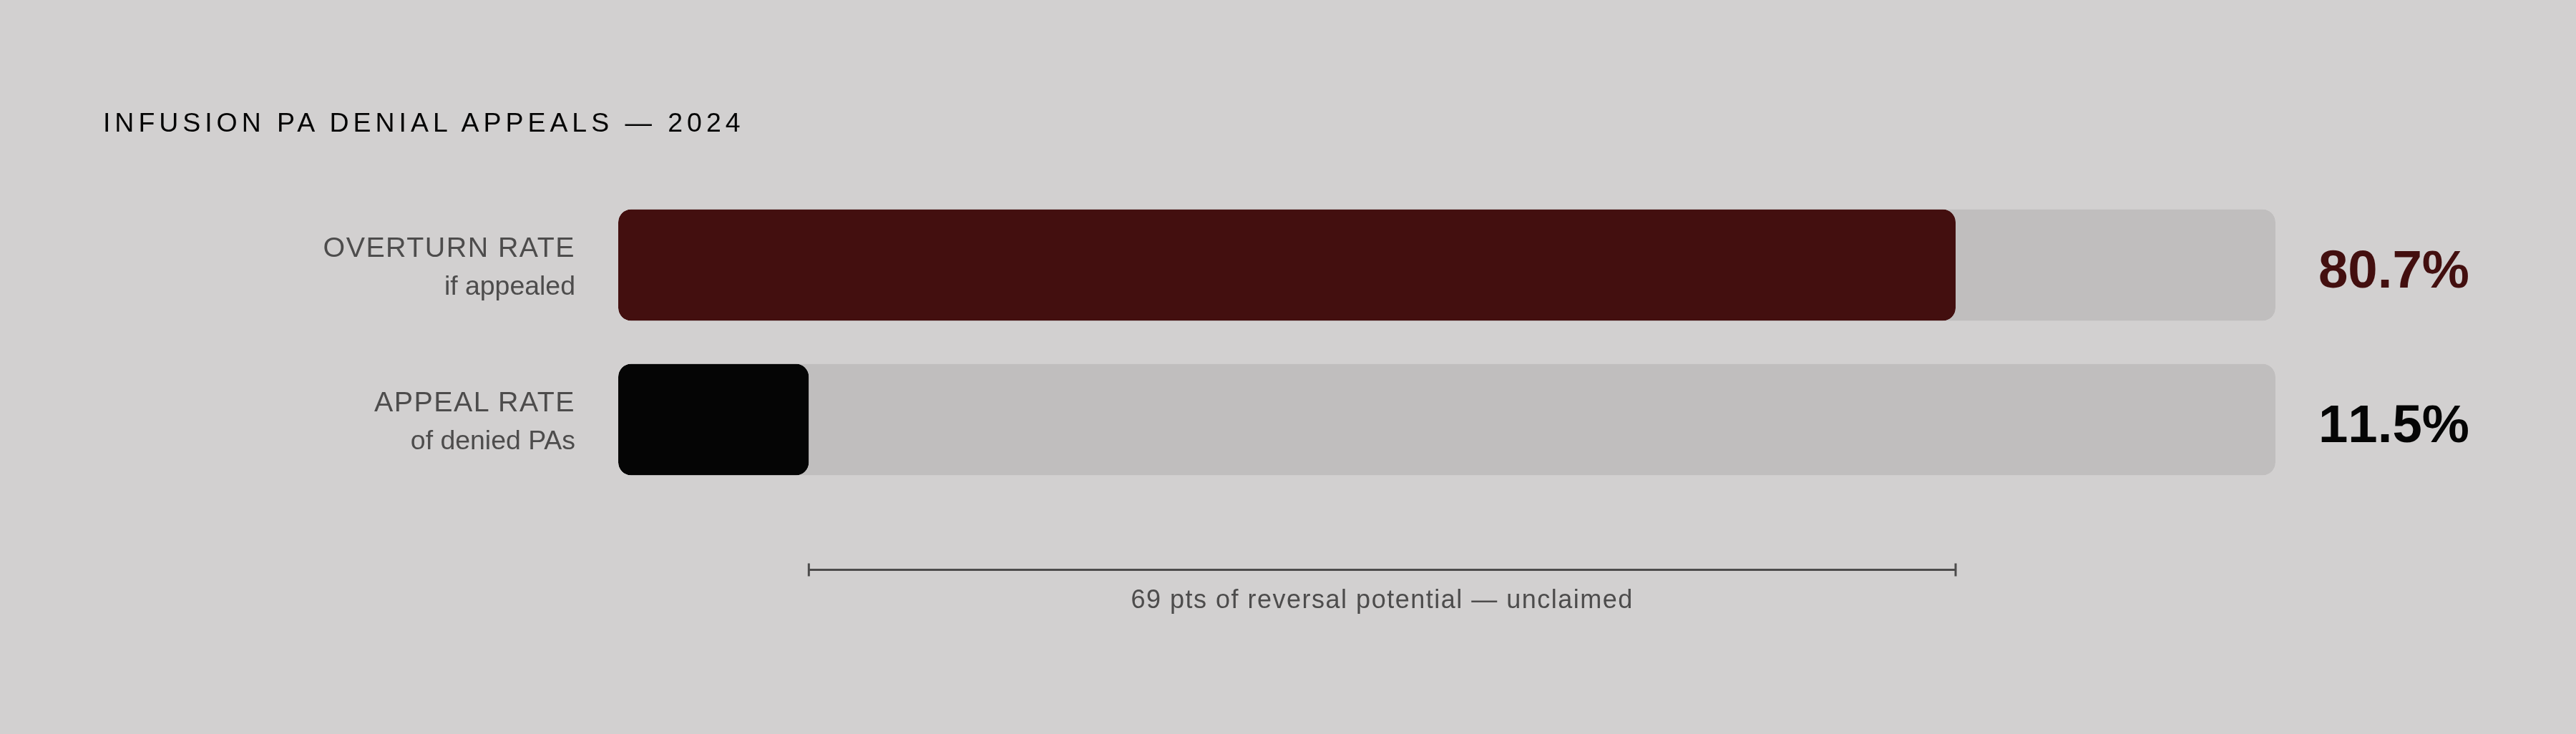
Only 11.5% of denied infusions are appealed, yet 80.7% of appeals succeed.
The central fact of infusion prior authorization is financial, not administrative. When a payer denies a biologic that a practice already purchased under buy-and-bill, the practice is holding drug cost it cannot recover until that denial is overturned. A single denied biologic infusion can represent tens of thousands of dollars absorbed before a claim was ever submitted. Payer-level overturn rate differences, in that light, stop being academic and start being the difference between recovered revenue and a write-off.
Ninety-nine percent of Medicare Advantage plans require prior authorization for physician-administered drugs under the medical benefit, per KFF analysis. Essentially every infusion encounter carries PA exposure. When CMS finalized its 2024 PA reform rule, Part B drugs, including the infusion biologics most at risk, were explicitly excluded. The most burdensome authorization requirements stayed intact. Maximum friction, maximum dollar exposure per denial. That is the operating environment. Everything below is about how to work inside it.
Medicare Advantage insurers processed approximately 50.2 million PA determinations in 2024, up from 37.1 million in 2019. That growth reflects structural expansion of PA volume, not just enrollment increases. The aggregate denial rate reached 7.7% in 2024, roughly 4.1 million denials, up from 6.4% the prior year and 5.7% pre-pandemic. Sustained trend, not a spike.
The headline overturn figure is striking: 80.7% of appealed denials were partially or fully reversed in 2024. More than eight in ten appeals succeeded. That number should stop every infusion billing team cold.
Here is what it conceals. Only 11.5% of denied PA requests were appealed in 2024, up from 7.5% in 2019. The overwhelming majority of denials go unchallenged, and only about one in five physicians consistently appeals adverse decisions. The revenue loss in infusion is not coming from unwinnable fights. It is coming from fights never started. That gap between an 80.7% overturn success rate and an 11.5% appeal participation rate is where practices are hemorrhaging money — quietly, consistently, every billing cycle.
Aggregate overturn rates measure outcomes among the minority who appealed. They say nothing about the recoverable revenue sitting in the unappealed majority. For infusion, where a single denial can represent a drug cost that would dwarf an entire month of billing work in another specialty, that gap is the most important number in the department. And then there is the payer variance the aggregate buries entirely.
How Much Payer Denial Rates Actually Diverge. The 3x Spread Across Major MA Plans
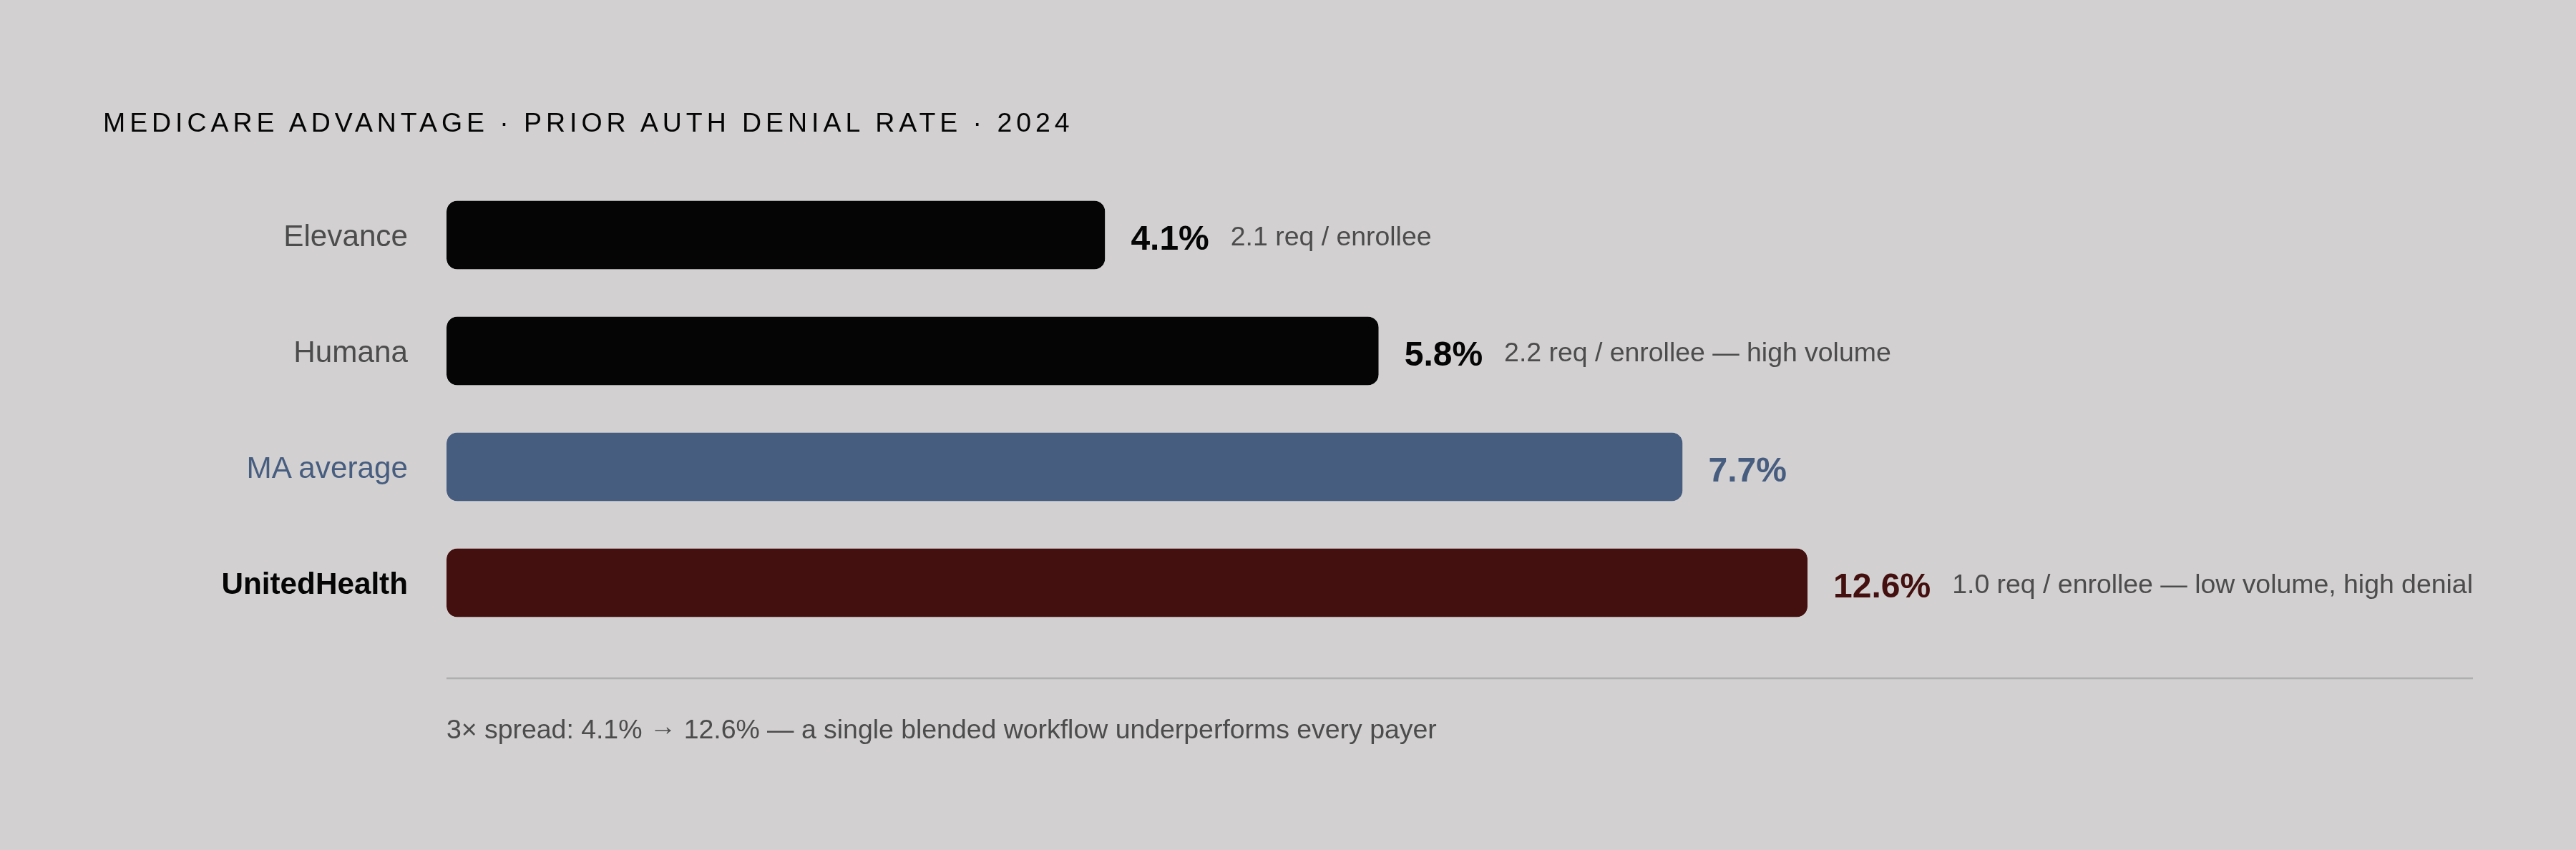
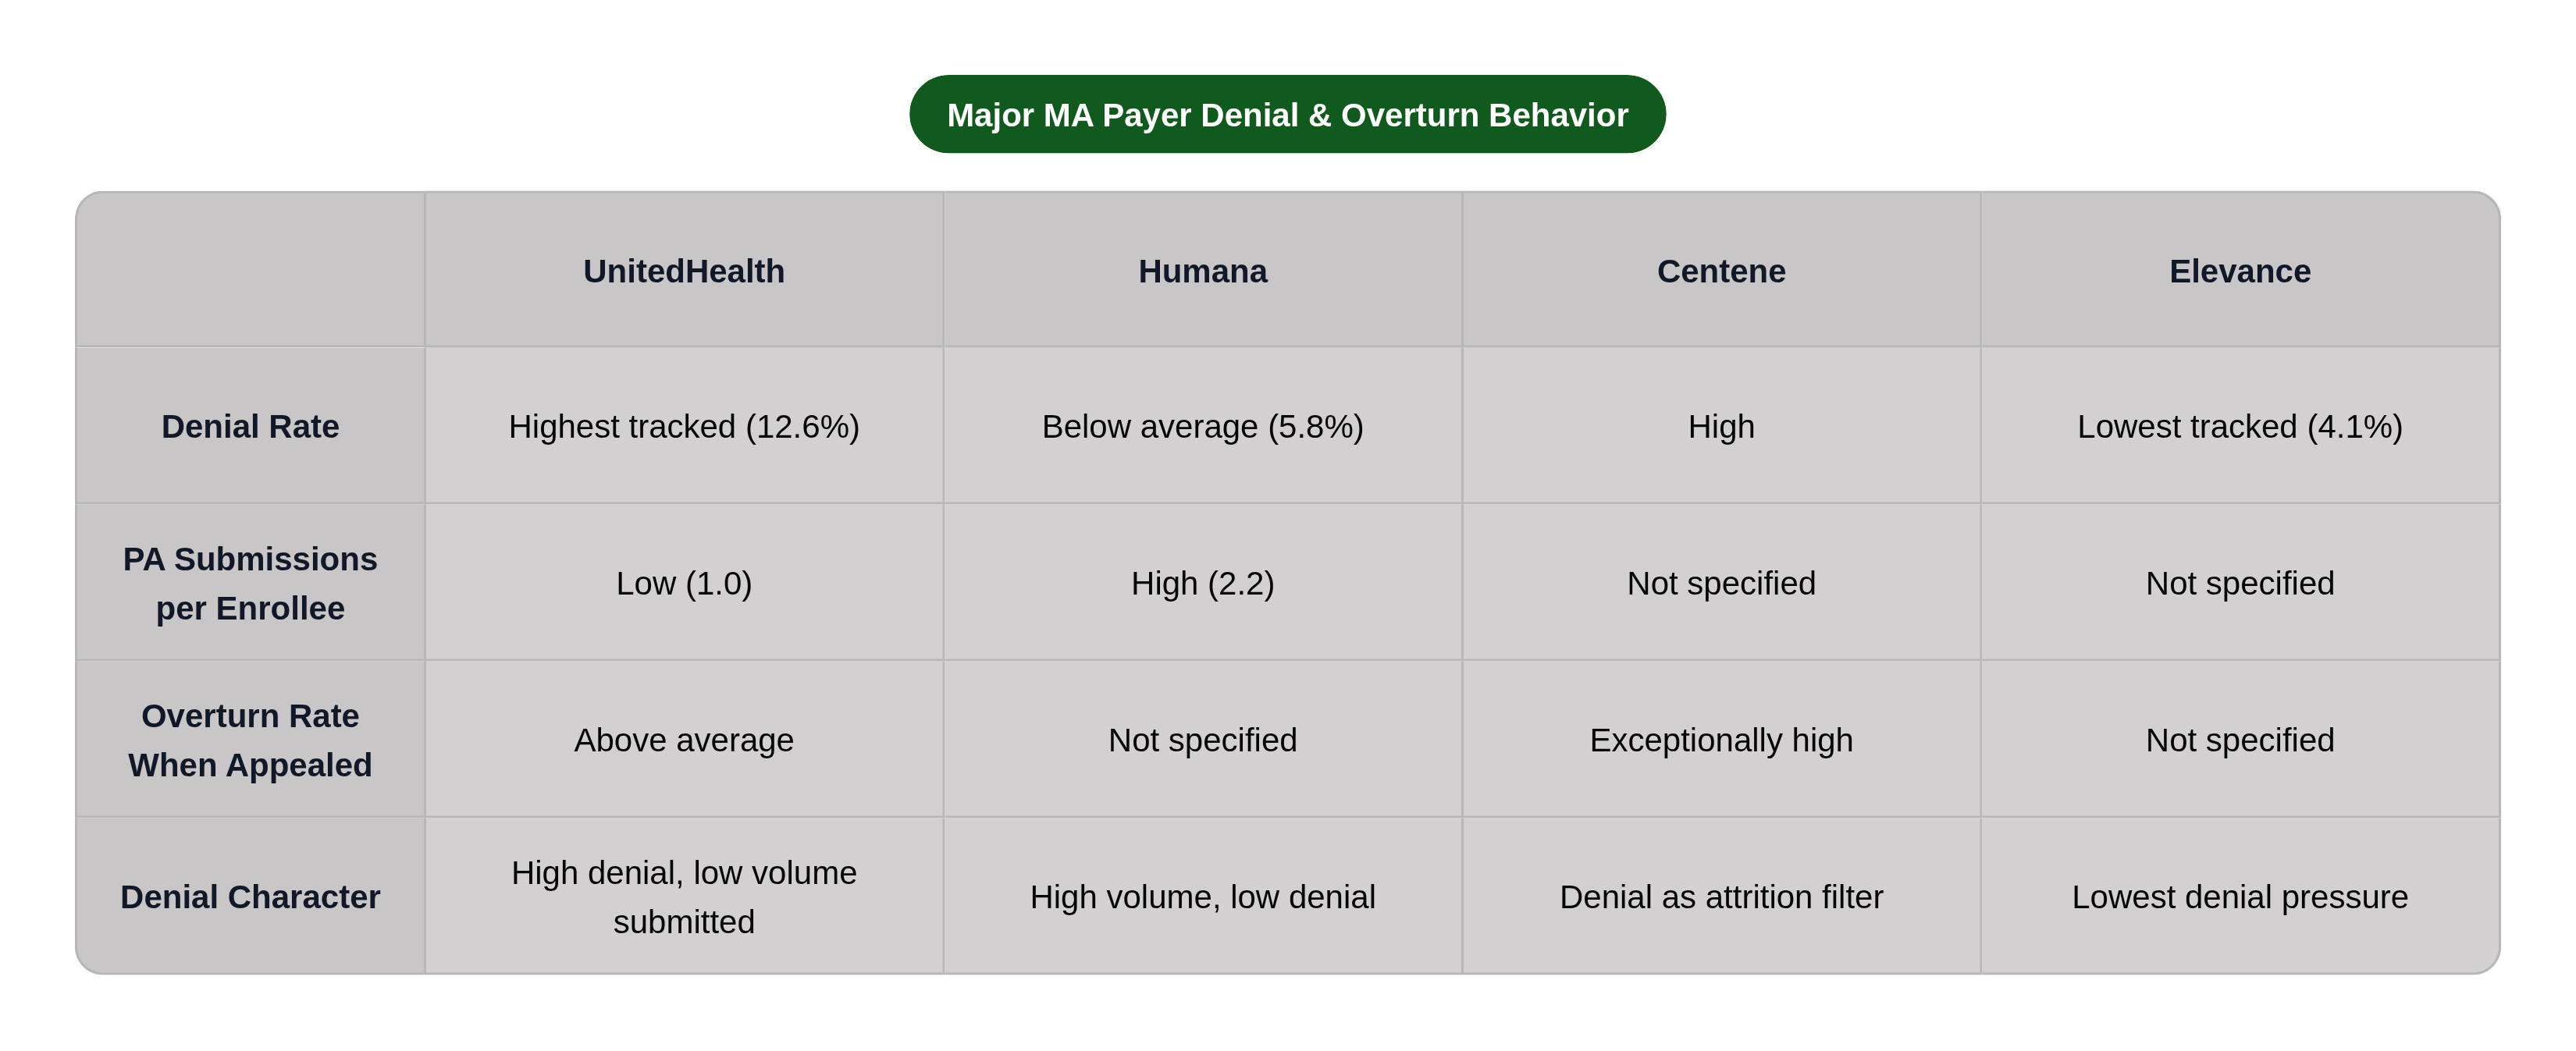
Denial rates among major MA payers ranged from 4.1% at Elevance to 12.6% at UnitedHealth in available 2024 data. That is not a rounding difference. That is a fundamentally different operational reality depending on your payer mix, and if you are calibrating your denial management workflow to some blended average, you are already losing at the payers that matter most.
UnitedHealth's behavior is structurally distinctive: among the lowest PA submission volumes relative to enrollment, at 1.0 requests per enrollee, yet a denial rate well above the market average. Humana presents the inverse, with among the highest submission volumes at 2.2 requests per enrollee and a below-average denial rate of 5.8%. The submission-to-denial ratio divergence suggests these payers are applying materially different coverage criteria, not merely processing requests at different speeds.
CMS-0057-F, finalized in January 2024, now requires MA organizations to publish standardized PA metrics annually. First reports covering calendar year 2024 were due March 31, 2025. The early public dataset confirms the 3x spread is a floor, not a ceiling.
A single denial management workflow calibrated to the average will underperform on every high-denial payer. Teams that manage all payers identically are, by design, leaving money on the table at the payers generating the most denials.
Where Overturn Rates Diverge Even More Sharply Than Denial Rates
Payer-level overturn rates are more extreme than the denial rate differences. Analysis of CMS data shows Centene's overturn rate reaching an exceptionally high level; CVS Health's nearly as high. When denials from these payers are appealed, they are almost always reversed.
That pattern has a name: the denial is functioning as a filter, not a clinical judgment. It sticks when practices do not appeal. It does not stick when they do. The entire business model of that denial depends on attrition — on practices treating a reversible decision like a closed door and walking away. Which, most of the time, is exactly what happens.
A Centene denial is not a coverage decision in any durable sense. It is a temporary hold that survives almost exclusively on the practice's failure to respond. The clinical case for the biologic was sound before the denial. It remains sound after. The only variable is whether someone submits the appeal.
PA timelines for infusion biologics already run 5 to 15 days under normal conditions, with some Medicare Advantage cases exceeding 60 days. The timing cost of an appeal cycle is real. So is the dollar amount on the line. The overturn data has already answered whether these are worth fighting. The remaining question is purely operational: does the practice have a system that ensures every eligible denial gets appealed, or does it depend on whoever happens to notice?
Why Infusion Denial Root Causes Concentrate by Payer Rather Than Distributing Randomly
Infusion PA denials do not distribute evenly across cause categories. They cluster, by payer, by therapy type, and often by site of service. Common triggers include patient demographic or insurance detail mismatches, ICD-10 codes that are too non-specific or misaligned with payer-specific policy, incorrect J-codes, and dosing errors. These are not random intake errors. They are predictable failure modes with predictable addresses.
The same J-code drug, submitted with identical clinical documentation, can pass at one plan and fail at another on different coverage criteria. What the billing team experiences as a denial feels generic. The underlying cause is payer-specific policy, and treating it as generic makes it impossible to prevent the next one.
Authorization expiration carries a particular structural risk for infusion. A treatment rendered after an authorization expires is treated identically to one rendered without authorization — a full denial regardless of clinical appropriateness. For recurring biologics dosed every four to eight weeks, the re-authorization cycle means expiration risk returns with every dosing interval. This is not a one-time intake problem. It is a recurring process risk embedded in the therapy schedule itself, and it will keep collecting revenue until someone builds a system specifically designed to intercept it.
One additional signal worth tracking: overall claims denial rates rose above 11% in 2024, even as PA-specific denial rates reflected different movement, with medical necessity and information request denials filling significant volume. Grouping all of that under a generic "medical necessity" category hides the payer-specific pattern needed to prevent recurrence. The root cause analysis has to go one level deeper, every time.
What Peer-to-Peer Appeals Accomplish That Standard Reconsideration Requests Do Not
Systematized peer-to-peer appeal workflows can achieve denial overturn rates around 64%, per case study data. Standard reconsideration requests go through the same criteria engine that produced the original denial. Peer-to-peer puts a clinician in direct contact with the payer's medical director. Different process, different outcomes.
The mechanism is not primarily clinical. Both parties generally have access to the same guidelines. The difference is procedural: peer-to-peer forces a human review under real-time conditions, where the payer's medical director must defend the denial in a live conversation, not through an asynchronous review queue. That shift changes outcomes.
The operational elements that make this work at scale are specific. A single coordinator owns peer-to-peer scheduling across all providers. Slots are booked within 48 hours of any denial. Each physician goes into the call with a denial brief: relevant clinical guideline citations, counter-arguments calibrated to the payer's stated denial reason, and a payer-specific intelligence file covering portal preferences, required attachments, and known J-code denial patterns. The brief for a Centene denial looks different from the brief for a UnitedHealth denial, and the overturn probability reflects that differentiation.
The limiting factor is physician time, which is exactly why the coordinator role and the 48-hour booking discipline are the leverage points. The clinical argument is often sufficient. The question is whether someone ensures the physician ever makes it.
How the New CMS Disclosure Requirements Change What Infusion Teams Can Know About Payer Behavior
CMS-0057-F requires MA organizations, Medicaid managed care plans, CHIP entities, and qualified health plan issuers to publish standardized PA metrics annually, including approval rates, denial rates, and overturn rates by plan. First reports covering 2025 were due March 31, 2026, meaning this information is entering the public domain in a structured, comparable format for the first time.
A 2026 requirement goes further: payers must provide a specific reason for every denied PA, including denials assisted by AI systems. That eliminates the black-box denial that offers no grounds for appeal. An AMA survey found approximately 61% of physicians reported concern about AI-driven denials, and that concern is not hypothetical. AI-assisted denials are already deployed across major payers, and the opacity with which they have operated is, as of 2026, no longer permitted.
New decision timelines also take effect in 2026: standard PA decisions within 7 calendar days, expedited decisions within 72 hours, down from the previous 14-day standard. For infusion scheduling, where authorization delays directly affect the patient's treatment date, that compression matters. Electronic PA exchange requirements follow in 2027, adding another automation layer to how authorization data flows between payers and providers.
The practical shift for infusion billing teams is this: the public disclosure dataset becomes a benchmarking instrument. Practices can now compare their own payer-level denial and overturn experience directly against published plan-level figures. Where a practice's experience diverges unfavorably from the published plan average, that gap is a diagnostic. It points toward a documentation pattern, a workflow failure, or a payer-specific policy misalignment that can be corrected. The information now exists to make that comparison. The question is whether practices are set up to use it.
Building the Operational Infrastructure That Turns Payer Intelligence Into Recovered Revenue
The gap between an 80.7% overturn success rate and an 11.5% appeal rate is not a knowledge problem. Every infusion billing team knows denials are recoverable. It is a workflow and capacity problem. Practices leaving this revenue on the table are not failing to understand the opportunity; they lack the denial tracking, payer-specific routing, and appeal throughput to capture it at volume.
The infrastructure required is specific. Denial tracking must be segmented by payer, by J-code, and by root cause, not by aggregate denial rate. A high denial rate at a specific payer for a specific J-code is a signal that can be acted on; a blended denial rate across all payers is noise. Payer-specific playbooks need to be maintained in real time as plan criteria and portal requirements shift, because they shift regularly and without announcement. PA lifecycle management has to start at scheduling, not at claim submission, with authorization expiration tracked at 30, 14, and 7-day intervals for recurring infusion cycles. Appeal throughput needs to route every eligible denial into reconsideration or peer-to-peer within a defined timeframe, not whenever someone happens to notice.
Gold carding offers a longer-term reduction in PA burden for high-volume, high-approval-rate providers. As of 2026, five states have enacted programs: Texas, Louisiana, Michigan, Vermont, and West Virginia. Texas requires at least five prior requests for a specific service and at least a 90% historical approval rate to qualify. Building toward gold carding eligibility is a legitimate strategic objective for practices with the volume to pursue it.
Ruby is a revenue cycle management platform built specifically for infusion billing, combining hands-on operators with software to handle prior authorizations, denials, and AR for infusion centers and buy-and-bill specialty practices, including the payer-level denial intelligence and PA lifecycle tracking this operating model requires. The practices that recover the most revenue from PA denials are the ones with the system that ensures nothing eligible goes unappealed. That is an infrastructure problem, and the data has already told you it is solvable.