Medicare Fee Schedule Lookup for Infusion Services
Navigate CMS, MAC, and ASP pricing files separately to avoid revenue loss on home infusion claims.

The fee schedule landing page at cms.gov/medicare/payment/fee-schedules is your entry point for MPFS downloads and the interactive single-code lookup tool. For HIT-specific rates, CMS maintains a separate HIT billing and rates page that publishes national rates by calendar year, geographic adjustment factor tables, and locality-adjusted rate files. The CY 2025 national HIT rates are downloadable as a PDF directly from that page. J-code drug pricing lives in the CMS Part B drug ASP pricing files, updated quarterly, and has nothing structurally to do with either the MPFS or the HIT table.
The MAC sites are not optional. Noridian, covering JE and JF jurisdictions, publishes locality-adjusted HIT fee schedules as CMS releases updated information. NGS Medicare makes a lookup tool available at ngsmedicare.com. First Coast Service Options publishes its own 2025 HIT payment rates at medicare.fcso.com and links directly from that page to the CMS ASP quarterly file. That linking choice matters: it signals how these resources are meant to work together, not in isolation.
The national CMS file sets the floor. The MAC site applies the locality adjustment. The ASP quarterly file governs the drug line on its own terms entirely. For not-otherwise-classified codes, MACs establish local relative values or flat local payment amounts that will not appear anywhere in the national download. If your practice bills NOC codes and you are stopping at the CMS national file, you have no usable benchmark, period.
How HIT G-Codes Are Structured and What the 2025 National Rates Actually Show
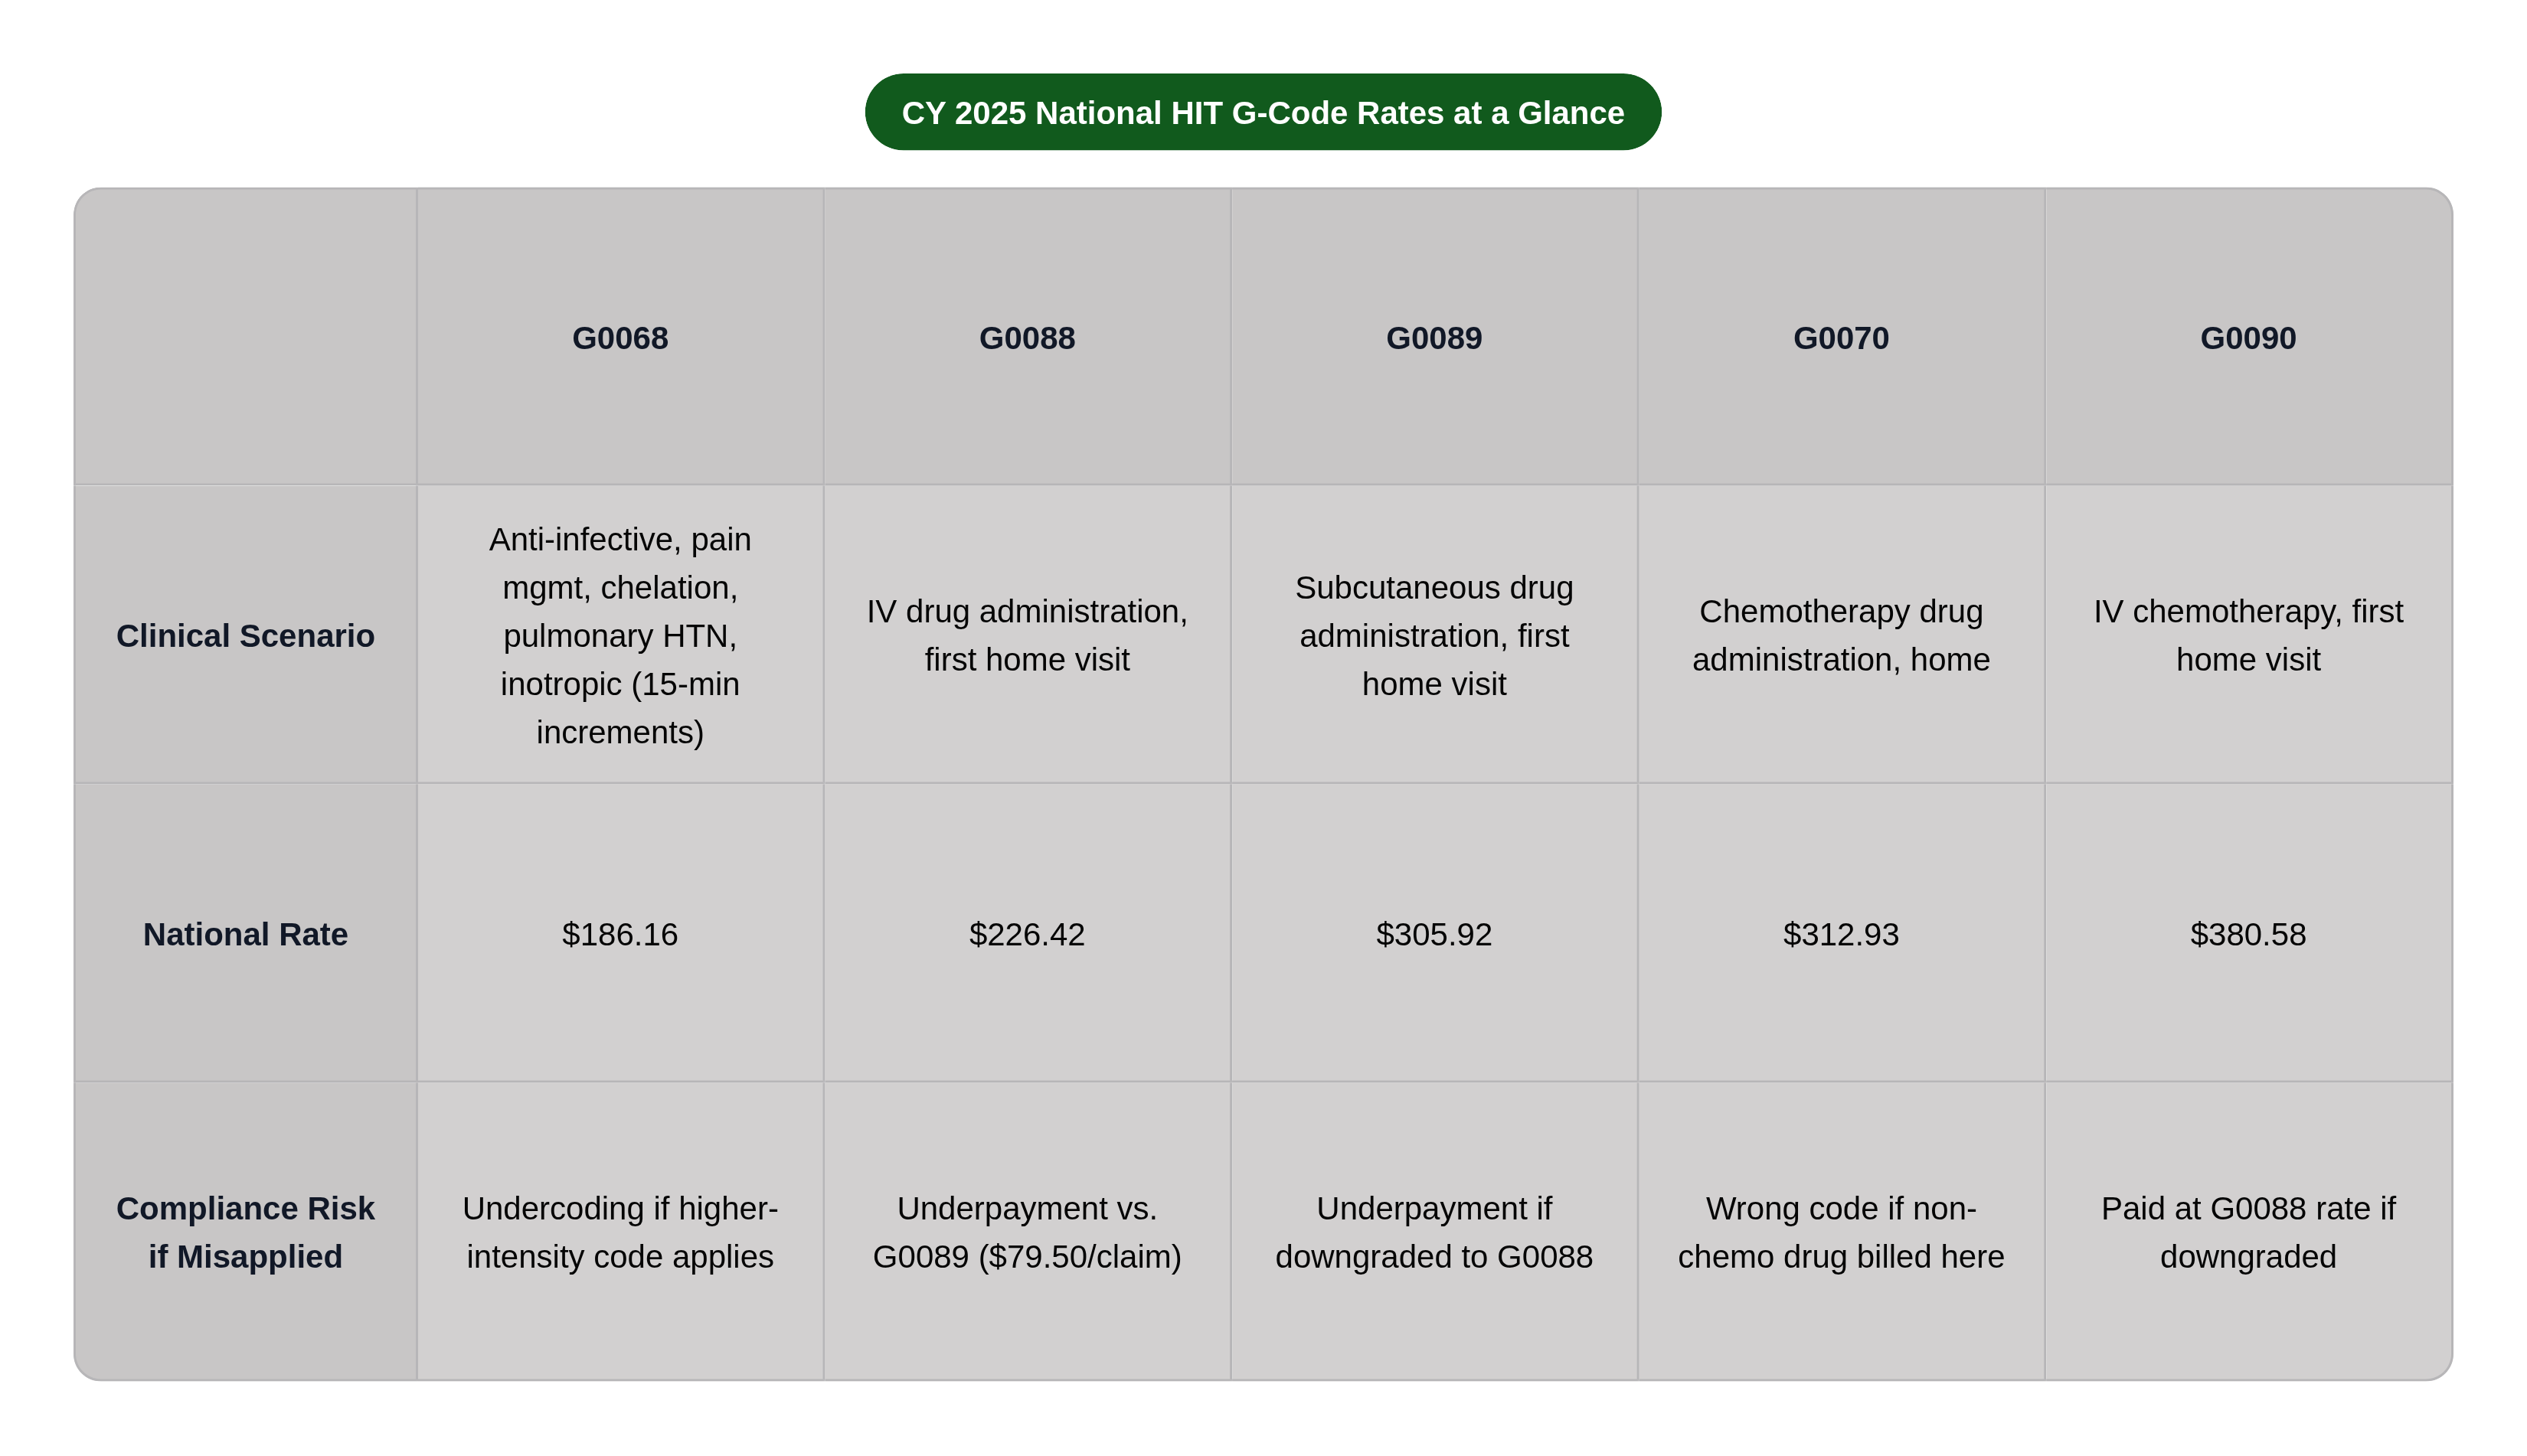
The G-code structure is not a menu of interchangeable administration slots. Each code maps to a distinct clinical scenario, and selecting the wrong one creates a compliance risk and a revenue loss in the same motion.
The CY 2025 national rates make the stakes concrete. G0068, covering professional services for anti-infective, pain management, chelation, pulmonary hypertension, and inotropic infusion drug administration in 15-minute increments, is set at $186.16. G0088, for administration of an IV drug on the first home visit, is $226.42. G0089, subcutaneous drug administration on the first home visit, is $305.92. G0070, for chemotherapy drug administration in the home, is $312.93. G0090, administration of IV chemotherapy on the first home visit, is $380.58.
That spread runs nearly $200 from lowest to highest. Billing G0088 for a subcutaneous administration that correctly maps to G0089 is a $79.50 per-claim understatement at the national rate, before locality adjustment widens or narrows the gap further. At any real claim volume, that variance compounds into material revenue loss that nobody flags because the claim paid.
These national rates are the starting point before geographic adjustment, not the payable amount. CMS publishes a separate CY 2026 National Home IVIG Items and Services Payment Rates table; IVIG operates on its own payment schedule, not the standard HIT table. Conflating the two produces the same benchmarking error, just in a different column.
How Geographic Adjustment Factors Shift What Medicare Actually Pays in Each Locality
Geographic Practice Cost Indices drive locality adjustment. For HIT, CMS applies a Geographic Adjustment Factor derived from GPCIs to convert the national rate into a locality-specific payable amount. A provider in a high-cost urban locality receives a materially higher payment than the national rate reflects. A rural provider may receive less.
For CY 2025 specifically: Section 3206 of the American Relief Act, 2025 extended the work GPCI floor through April 1, 2025. CMS revised the CY 2025 GAFs to reflect that extension, but they are otherwise unchanged from CY 2024 GAFs. That context matters when troubleshooting a payment discrepancy near that effective date, because the before-and-after distinction is subtle enough to produce genuine confusion.
CMS publishes geographically adjusted rates for initial and subsequent visits as a separate file from the national rate table, and the MAC sites publish their own locality-specific versions. The reconciliation failure I keep seeing is practices benchmarking remittances against the national rate without applying the locality adjustment. That single gap produces two failure modes simultaneously: missed underpayments in high-cost localities, and spurious error flags on correct payments in lower-cost jurisdictions. Identify your MAC jurisdiction, pull the locality-adjusted file from that MAC's fee schedule page, and stop treating the national document as the final answer.
J-Code Reimbursement Under ASP Pricing and Why It Moves Independently of the Administration Schedule
Medicare Part B reimburses most J-code drugs at ASP plus 6%. This applies to iron infusions, biologics, and other physician-administered drugs billed under buy-and-bill. The administration CPT code and the J-code are billed and reimbursed as separate line items. A remit showing correct payment on the administration line tells you nothing whatsoever about the drug line.
ASP pricing updates quarterly. The rate for a given J-code in Q1 may differ meaningfully from Q3 of the same calendar year. A practice using a rate file from the prior quarter will miscalculate expected reimbursement on every drug claim until someone updates the file. Plenty of practices treat the fee schedule lookup as an annual task. That is where the gap lives.
Each J-code maps to a specific drug, formulation, and unit of measure; billing the wrong unit count creates either an underpayment or an overpayment, and either outcome generates downstream risk. NOC J-codes for drugs without an assigned code require narrative description and carry a higher inherent denial rate. The dollar magnitude per line is large enough that even a fractional rate error becomes a significant variance per encounter, not a rounding difference.
First Coast Service Options' direct link from its fee schedule page to the CMS ASP drug pricing file reflects the intended workflow: J-code benchmarking belongs to the quarterly ASP file, not to the HIT schedule, not to the MPFS.
The Financial Exposure When a Buy-and-Bill Claim Is Denied or Underpaid
Under buy-and-bill, the practice acquires the drug before administration. That acquisition cost is already spent when the claim goes out. A denial leaves the practice holding that cost with no reimbursement path. At the per-encounter drug costs typical of biologics or specialty infusions, the exposure is not a rounding error.
Cash flow mechanics compound this. Reimbursements often arrive on net 30 or net 60 terms, and practices that rely on one patient's reimbursement to fund the next patient's drug acquisition have no buffer when a high-dollar claim is denied or sits in adjudication past its expected resolution window. That fragility is structural, not incidental.
Underpayments on the drug line are more insidious than denials, precisely because they do not look like a problem. If ASP plus 6% is the correct rate but the payer remits at ASP only, the 6% difference on a $20,000 drug is $1,200 per encounter. That claim is paid. It will not appear on a denial report. It will not trigger a follow-up queue. It is permanently invisible unless someone on the billing team is reconciling at the line level against the correct quarterly ASP rate.
Initial denial rates reached 11.8% in 2024, up from 10.2% in prior years. Infusion claims, with their clinical complexity and high dollar values, attract more manual review than routine Part B claims. A practice cannot identify a $1,200 drug-line underpayment without knowing what the correct ASP rate was at the date of service. The fee schedule lookup is not optional infrastructure; it is the prerequisite to any of this making financial sense.
Reading a Remittance Against the Fee Schedule to Catch Underpayments Before They Age Out
Underpayments do not trigger denial flags. They arrive as paid claims with an incorrect allowed amount. The remit looks resolved. Revenue is permanently lost if nobody catches it within the window.
Line-level reconciliation means matching each remit line to its correct benchmark, and the benchmark differs for each line type. For the administration G-code or CPT line, compare the allowed amount to the locality-adjusted fee schedule for the correct MAC jurisdiction and the date of service. For the J-code drug line, compare the allowed amount to ASP plus 6% from the CMS quarterly file that was current at the date of service, not the current quarter. For IVIG lines, the separate IVIG payment rate table is the operative reference.
The underpayment patterns that recur most often in infusion remits share recognizable root causes: the payer applying the national rate instead of the locality-adjusted rate, or applying the wrong MAC locality entirely; the drug line paid at ASP without the 6% add-on; the administration code downgraded, G0090 chemotherapy rate paid at the G0088 general IV rate, for instance; units billed correctly but reimbursed for fewer units than administered.
Medicare timely filing for redeterminations is 120 days from the remit date. Underpayments not flagged within that window become permanent write-offs. For practices running high-frequency infusion schedules with biweekly or monthly biologics, that 120-day clock moves fast. A systematic underpayment — a payer consistently remitting at ASP without the add-on — repeats on every single claim until someone fixes the root cause at the contract or billing level. Calculate what that pattern costs across a full quarter and the per-claim dollar impact becomes almost beside the point.
A current, locality-specific fee schedule file needs to be on hand at the time of remit review.
Where Fee Schedule Lookups Fit Inside a Denial Prevention and AR Management Workflow
Fee schedule knowledge is not only a post-payment tool. It shapes front-end decisions in ways that compress denial rates before claims go out.
Knowing the correct expected reimbursement for a drug-plus-administration combination lets the team set realistic AR benchmarks and identify claims in the 60-plus-day bucket that are likely underpaid rather than simply slow. Expected-versus-allowed variance reports, built on accurate fee schedule data, surface payer-specific underpayment patterns that point to contract problems rather than isolated billing errors. That distinction changes where correction effort actually goes.
Several denial root causes connect directly back to fee schedule misreads. Incorrect G-code selection produces a code-to-diagnosis mismatch that triggers denial. J-code unit errors generate medical necessity flags or overpayment demands. Prior authorization approvals tied to a specific drug and dose must match the J-code and units billed; a rate lookup that reveals a dose change also signals a PA review need before the claim goes out.
High-dollar infusion claims involving biologics or chemotherapy warrant manual remit review against the fee schedule. The dollar-per-hour return on reconciliation is highest where drug costs are largest. Per Experian Health's 2025 State of Claims report, 41% of providers report at least one in ten claims denied. In infusion, where a single claim can represent tens of thousands in drug cost, the denial rate problem is a magnitude problem, not merely a percentage problem.
Fee schedule files need to function as a standing reference layer in the RCM workflow, refreshed on a known cadence tied to CMS release schedules. That discipline is the difference between reconciliation as a routine step that catches underpayments before they age out, and reconciliation as a reactive investigation triggered only when a payment looks obviously wrong. By the time it looks obviously wrong, a lot of the damage is already done.