Key RCM Performance Metrics Healthcare CFOs Track
Infusion billing failures concentrate in CPT hierarchy and prior auth, not generic coding lapses.

Top-performing practices exceed a 98% clean claim rate on first pass. Below 90% signals a systemic front-end problem. Those benchmarks are not wrong. What they fail to account for is how structurally punishing it is to hit 98% when the claim itself is built on a CPT hierarchy that demands precise sequencing, modifier logic, and nursing documentation to support every billable unit.
Infusion billing starts with a primary infusion code, then layers add-on codes for additional hours, concurrent drug administrations, and push injections. Each has its own billing rule. Each gets adjudicated by automated payer edits before a human ever touches the claim. Start and stop times drive the unit count. If nursing documentation does not match the billed structure, the claim fails a Medically Unlikely Edit before it reaches review. Modifiers are not optional; missing or misapplied modifiers trigger National Correct Coding Initiative edits, push the claim to manual review, and create compliance exposure. Exceeding unit caps auto-denies even when the service was legitimately delivered and fully documented.
This is a complexity problem specific to the architecture of infusion claims, not a documentation culture problem or a coder attention problem. The failure modes concentrate in add-on codes, in concurrent drug billing, in unit conversion from infusion time to billable increments. A clean claim rate below 95% in infusion almost certainly reflects a coding or charge capture failure inside that hierarchy, not a generic eligibility miss at the front desk.
The more useful question is about the geography of the failure. Is it concentrated in certain CPT families, certain payers, certain sites? A 93% clean claim rate failing uniformly across add-on codes points to a training or template problem. The same rate failing at one location and not others points to a documentation or charge capture workflow breakdown at that site. These are not interchangeable diagnoses, and the distinction matters because clean claim rate is the upstream driver of everything downstream. Denial rate, days in AR, and cost to collect all worsen in direct proportion to first-pass failure. In infusion, where a single rework cycle on a claim north of $4,000 consumes disproportionate administrative time, first-pass failure is a direct operating cost, not a billing inconvenience.
Denial rate in infusion: why 11.8% is the wrong reference point and 5% is the right floor
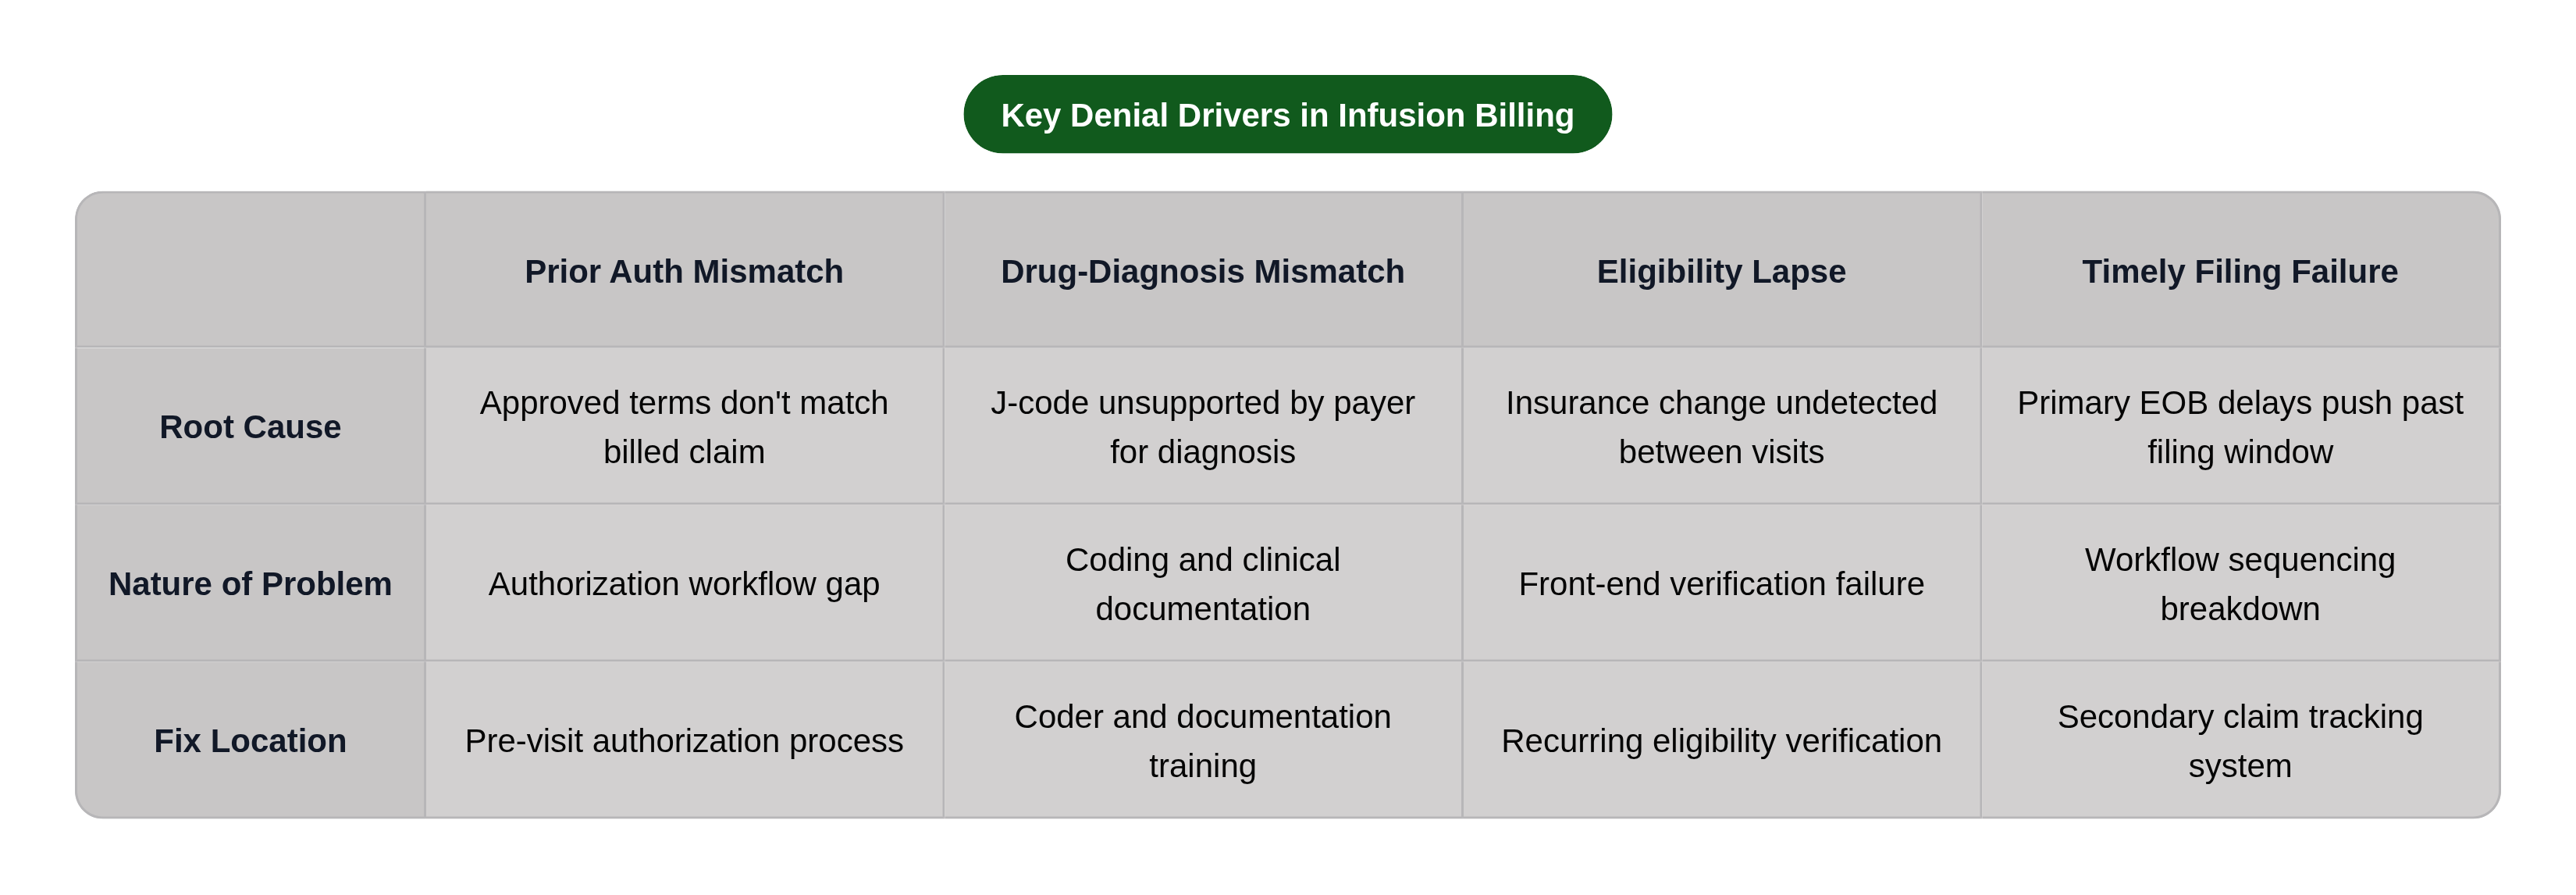
Initial claim denial rates hit 11.8% in 2024, up from 10.2% in 2020. That figure circulates widely, and most CFOs have seen it. It is also a hospital-dominated average, which makes it the wrong benchmark entirely if you are running an ambulatory infusion operation. High-functioning practices across specialties operate below 5%. For infusion, that 5% ceiling is the minimum expectation, not a stretch goal.
The stakes are different here because of dollar concentration. Denials tied to medical necessity averaged $450 per denial in recent data, and that reflects the general claims universe. A denied biologic infusion can represent tens of thousands of dollars in unreimbursed drug cost because, in a buy-and-bill model, the drug has already been purchased, administered, and is now sitting as an unrecovered expense on the balance sheet. An MGMA poll found that denials and appeals represent the single largest revenue cycle leak for nearly half of all practices surveyed. In infusion, that leak is disproportionately damaging relative to volume because so much value concentrates in so few claims.
The denial drivers that matter most in infusion are not the ones general RCM teams typically focus on. Prior authorization mismatches, where the approved drug, dose, or site of care does not match what was billed, generate denials that are often entirely preventable. Drug-to-diagnosis mismatches, where the J-code is billed against a diagnosis the payer's policy does not support for that specific drug, are a coding and clinical documentation problem. Eligibility lapses on recurring patients, where insurance changes between treatment cycles go undetected until the claim hits, compound across visits. Timely filing failures on secondary claims, where primary EOB delays push the secondary past its filing window, are a workflow sequencing problem. Each has a different fix, and a generic denial rate report does not tell you which one you are dealing with.
A 4% denial rate concentrated in high-cost biologics is a materially worse cash problem than a 7% denial rate spread across hydration claims. The dollar-weighted denial rate is the number that matters.
The abandonment figure is the most operationally important data point here: the majority of denied claims are never reworked or resubmitted. In infusion, where the recoverable percentage of denials is extraordinarily high when the claim is properly reworked, that abandonment rate is a fixable cash problem that has been mislabeled as an unavoidable one.
Prior authorization as a leading indicator hiding inside the denial rate
Virtually all Medicare Advantage plans require prior authorization for physician-administered drugs under the medical benefit. This is not an edge case; it is the operating reality for most infusion practices. The prior authorization burden in this space is structural, and it behaves more like a cash flow variable than an administrative task.
The timing problem is where it becomes a CFO issue. Drug cost is committed the moment treatment begins. Prior authorization failure surfaces as a denial weeks later, after the drug has been administered and the claim has gone out. For recurring therapies, a single authorization lapse does not produce one denial; it cascades across multiple treatment visits before anyone catches it. Unlike pharmacy benefits, physician-administered infusion drugs under the medical benefit carry no regulatory mandate for electronic prior authorization or defined response timelines. That asymmetry between drug cost timing and authorization resolution timing is a structural cash flow risk, and it lives entirely outside the billing dashboard until it is already a denial.
This is why prior authorization cannot be treated as a billing function. By the time a claim is submitted, a prior authorization problem has already become a denial problem. The intervention window is pre-visit, which means the metrics tracking it belong upstream from the billing dashboard.
The forward-looking prior authorization metrics that actually matter: average payer turnaround time by therapeutic class, because delays in certain drug categories signal where treatment scheduling needs a buffer; first-time denial rate by payer and drug, which diagnoses which payers are systematically rejecting initial submissions; and authorization expiration rate, the percentage of active patients whose authorization expires before their next scheduled treatment. That last one is the leading indicator for the lapse cascade. In one survey of revenue cycle professionals, prior authorization ranked as the top revenue cycle challenge by a substantial margin. It belongs on the CFO dashboard, not buried in the billing team's task queue.
Days in AR and why infusion practices should carry a higher number, but own it completely
The standard days in AR benchmark for well-run practices falls under 30 days, with best-performing operations closer to 25. Infusion practices should expect to carry a higher number than general ambulatory. The CFO's job is to know precisely why, and to be unsatisfied with any explanation that cannot be traced to a specific structural cause.
High-dollar claims attract more manual payer review; that is documented behavior, not anecdote. Manual review cycles in infusion and oncology add weeks to payment timelines. Prior authorization delays upstream extend the window before a clean claim can even be submitted; if authorization takes two weeks to adjudicate, the billing clock has not started yet. Secondary claim processing depends on primary EOB receipt, and complex payer stacks are common in infusion. Each handoff adds structural lag. The adjudication environment is getting more complex, not less, as payers increasingly use automated systems to flag under-documented or unusual claims for additional scrutiny.
None of that excuses a high days in AR number. It contextualizes it. The more diagnostic version of the metric is not the aggregate number but the aging distribution and where it concentrates. A days in AR of 38 driven by two payers with known manual review cycles is a different problem than 38 days spread evenly across the payer portfolio. The first is an expected structural delay. The second is operational drift. They require entirely different responses, and conflating them is how practices end up treating a process failure as a payer problem.
Claims aging past 90 days in infusion are at risk on two dimensions simultaneously: timely filing deadlines close in, and high-dollar claims that age that long typically indicate a prior authorization dispute, a medical necessity challenge, or a coding conflict that will not resolve without active, targeted intervention. Passive follow-up on a 90-day infusion claim is revenue abandonment with extra steps, not follow-up.
The question worth asking: what percentage of AR dollar value sits in claims over 90 days, and is that concentration in payers or drug types with known extended adjudication timelines, or is it in claims that should have been resolved and were not?
Net collection rate and the underpayment problem that doesn't show up until it's too late
HFMA sets the minimum acceptable net collection rate at 95%, with optimal performance running from 97% to 99%. Anything below 95% signals revenue loss from late filings, underpayments, or coding errors. Those thresholds are correct. The problem in infusion is not the threshold; it is what the metric can and cannot see.
Net collection rate measures what was collected against what was contractually owed. It surfaces underpayment only if someone is comparing the remittance to the contracted rate at the line level. In infusion, the drug component of the claim carries its own contracted reimbursement logic, AWP-based, ASP-based, or fee schedule, that is entirely separate from the administration code. A payer can adjudicate the administration fee correctly, pay it in full, and systematically underpay the J-code. The net collection rate will not surface that discrepancy unless the drug component is being reconciled at the line level against the contracted rate. Most operations are not doing that reconciliation at the frequency or granularity required to catch it.
CMS's 2024 Medicare Fee-for-Service supplemental improper payment data found a 14.1% improper payment rate for infusion pumps and related drugs, with a projected improper payment amount of $89.5 million. That is government payer data, in a fee schedule environment with published rates. It reflects how frequently the drug component specifically is paid incorrectly even when the correct payment amount is unambiguous.
The mechanism by which this becomes permanent loss is mundane: the remit posts, the balance clears, the claim closes. Without drug-level reconciliation by J-code and payer, a systematic underpayment of a few hundred dollars across hundreds of claims becomes a series of write-offs with no denial to trigger rework. The net collection rate looks fine. The revenue is gone.
Infusion operators run on margins that leave little room for systematic drug underpayment. A consistent pattern of incorrect J-code reimbursement, on the highest-cost line item on the claim, can compress profitability in ways that never surface as a denial, never generate a rework workflow, and never appear as a flag on the standard RCM dashboard. What a CFO should require alongside the net collection rate is a reconciliation process that compares drug reimbursement by J-code against contracted rates by payer, run regularly enough to catch systematic patterns before the write-off window closes.
Cost to collect and what it reveals about operating model efficiency in infusion RCM
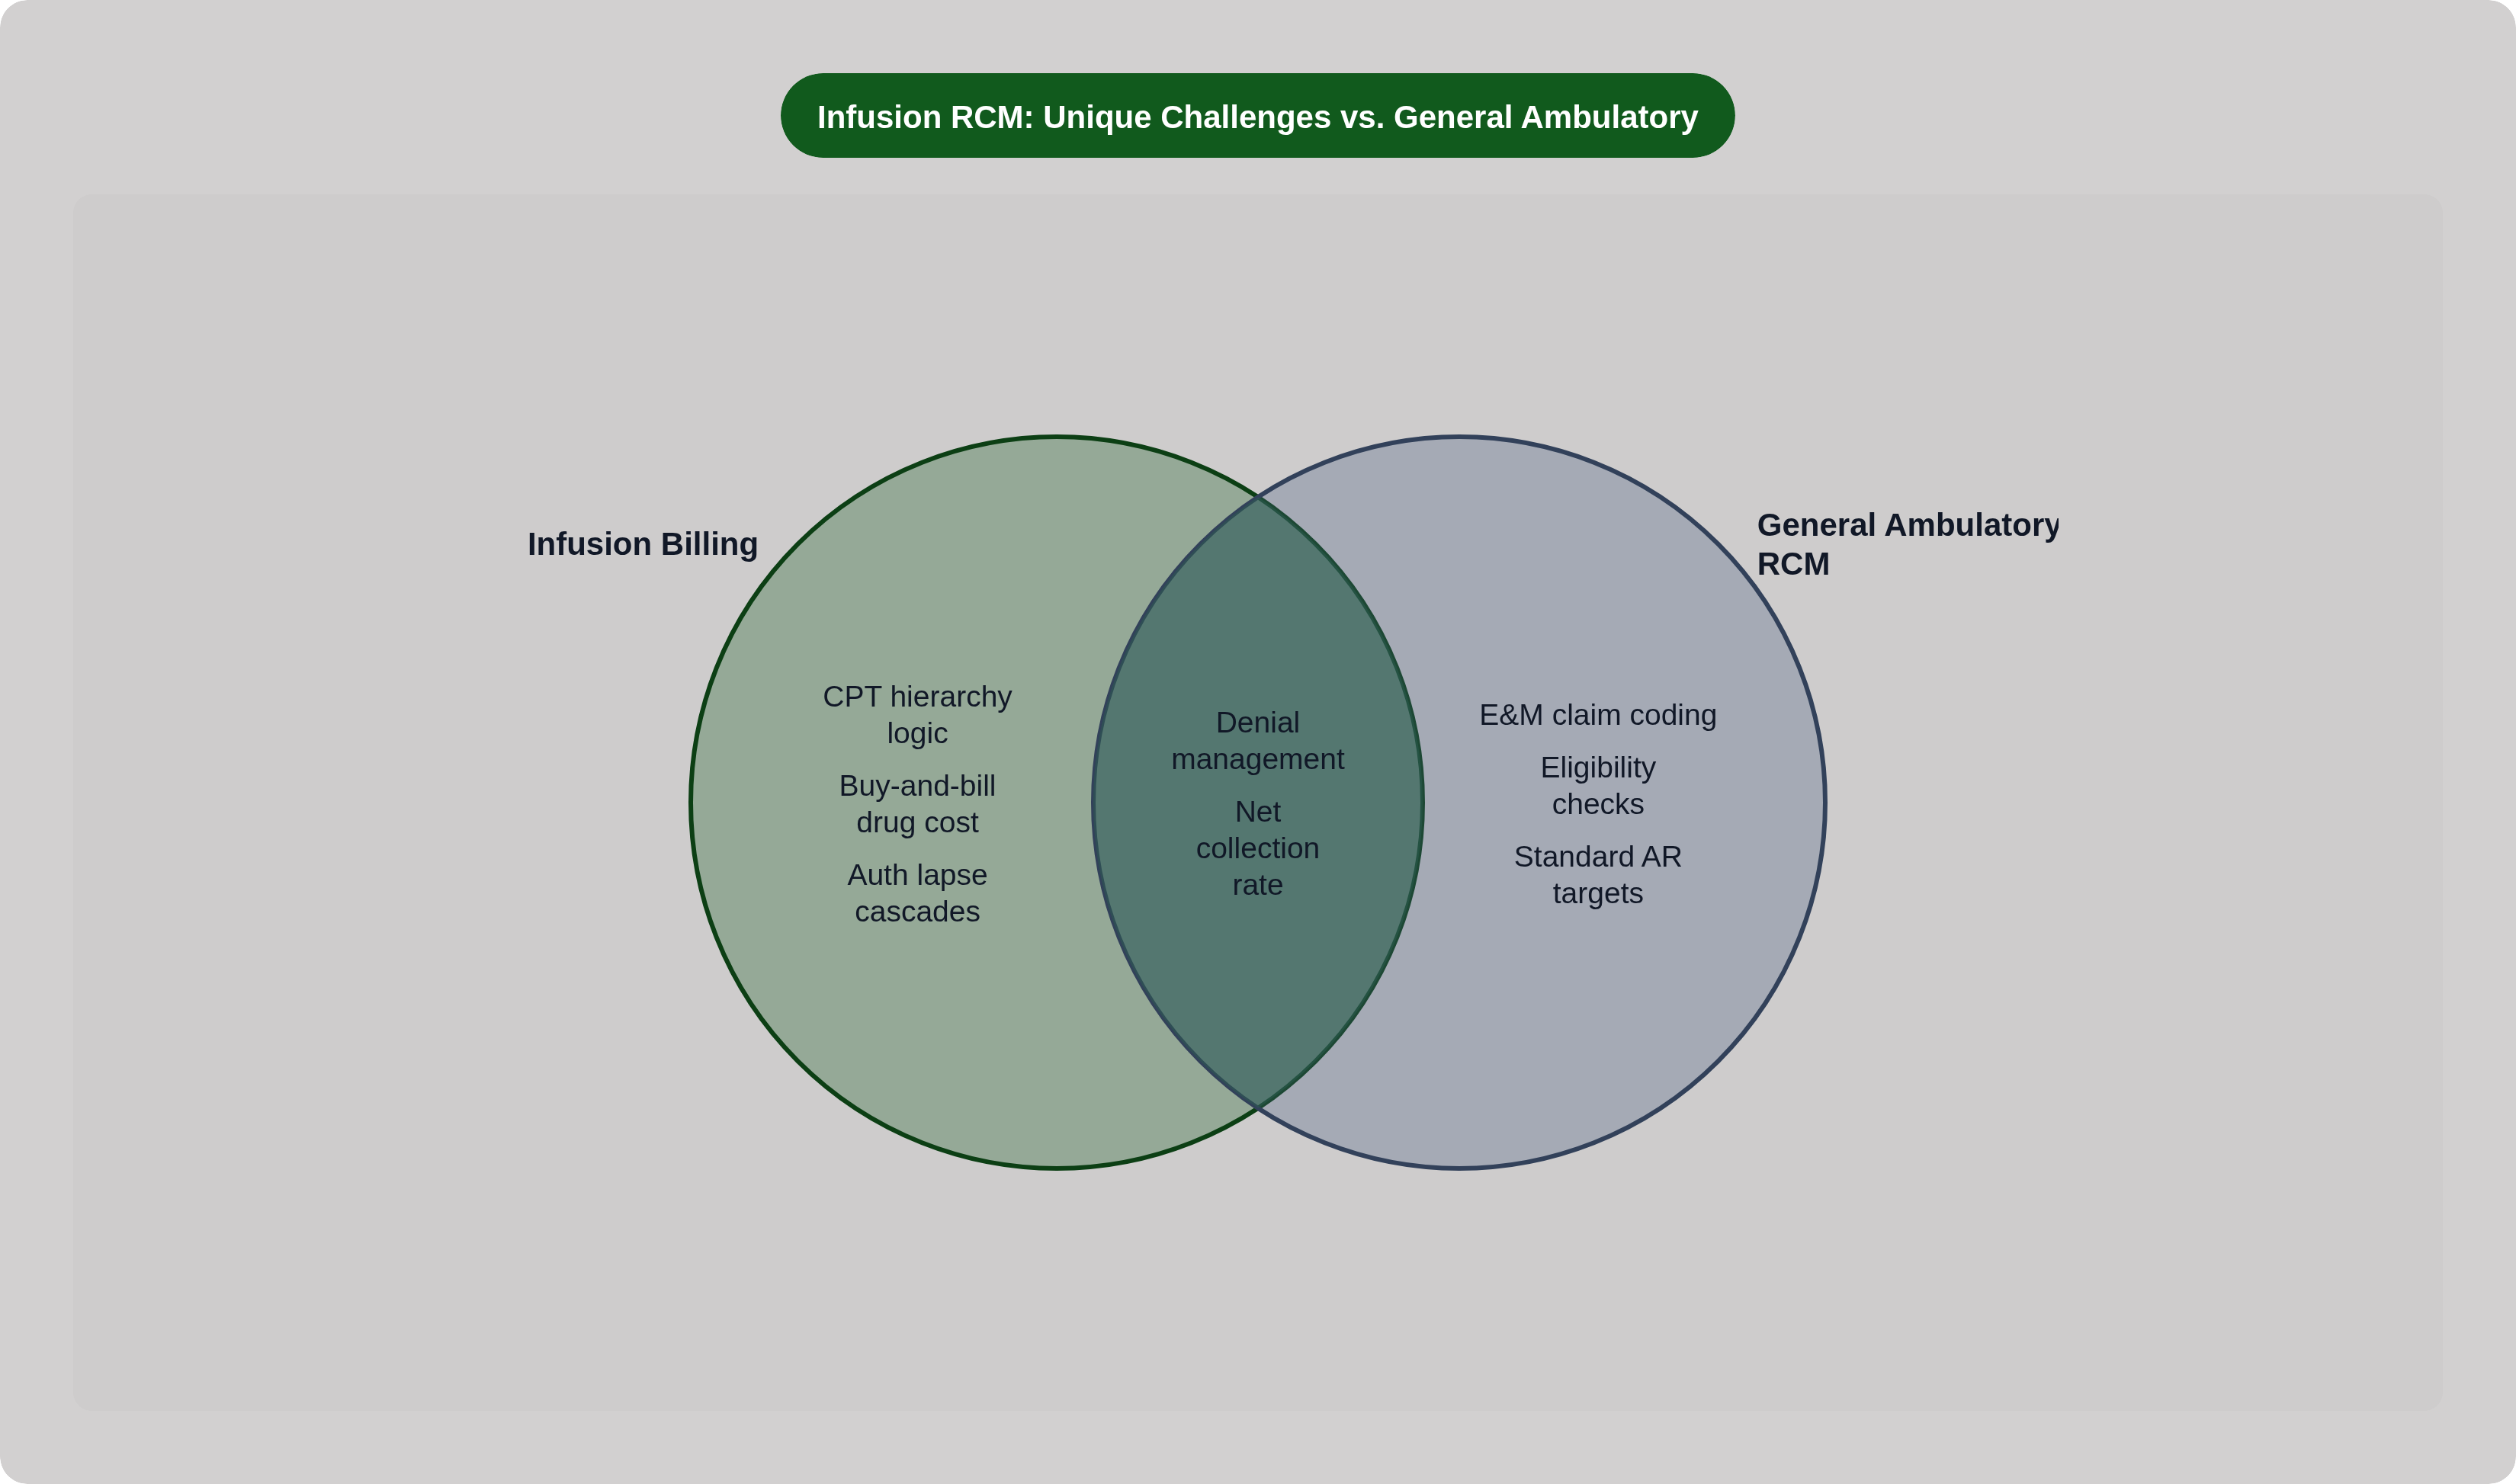
The standard benchmark for cost to collect runs between 3% and 8% of net collections, varying by practice size, specialty, and average revenue per visit. In infusion, that range needs an interpretive adjustment before it means anything useful.
Average revenue per infusion visit at an ambulatory center runs $3,500 to $5,000. That higher average claim value means a given dollar amount of RCM spend represents a lower percentage of collections than it would in a lower-revenue-per-visit specialty. Cost to collect can look artificially efficient in infusion not because the operation is running well, but because the denominator is large. A practice spending the same absolute dollars on billing as a primary care office will show a meaningfully lower cost-to-collect percentage, while carrying more administrative complexity per claim, not less. The favorable percentage flatters the operation in a way that can mask significant process inefficiency.
Infusion billing is genuinely more labor-intensive per claim than general ambulatory. Prior authorization management, nursing documentation review, J-code unit reconciliation, modifier validation, and multi-payer coordination all add handling cost that an E&M claim does not carry. That cost is real, and it should inform how the benchmark is applied.
Where cost to collect escalates in poorly designed infusion RCM operations is predictable. High rework rates from first-pass denials are the most direct driver; each rework cycle on a complex infusion claim consumes more staff time than reworking a standard claim of equivalent dollar value, because the coding logic is more involved and the documentation review is more intensive. Manual prior authorization tracking that requires staff intervention at every renewal cycle, instead of systematic expiration monitoring, adds recurring administrative cost that scales directly with patient volume. Denial abandonment, where denied claims are written off rather than reworked, lowers visible rework cost while eliminating recoverable revenue; measured correctly against recovered revenue rather than gross collections, abandonment inflates the true cost to collect even as it makes the operation appear leaner.
The operational question cost to collect is really asking: how much of the administrative burden in this practice is structural and necessary, and how much is generated by process failures that compound at every step? In infusion, those process failures are specific enough to diagnose. Clean claim rate, denial root cause concentration, prior authorization expiration rate, and J-code reconciliation gaps each point to a discrete part of the operating model. Cost to collect is where all of them land on the income statement.